Dashboard
The dashboard provides a real-time overview of your Acteon gateway's health and activity.
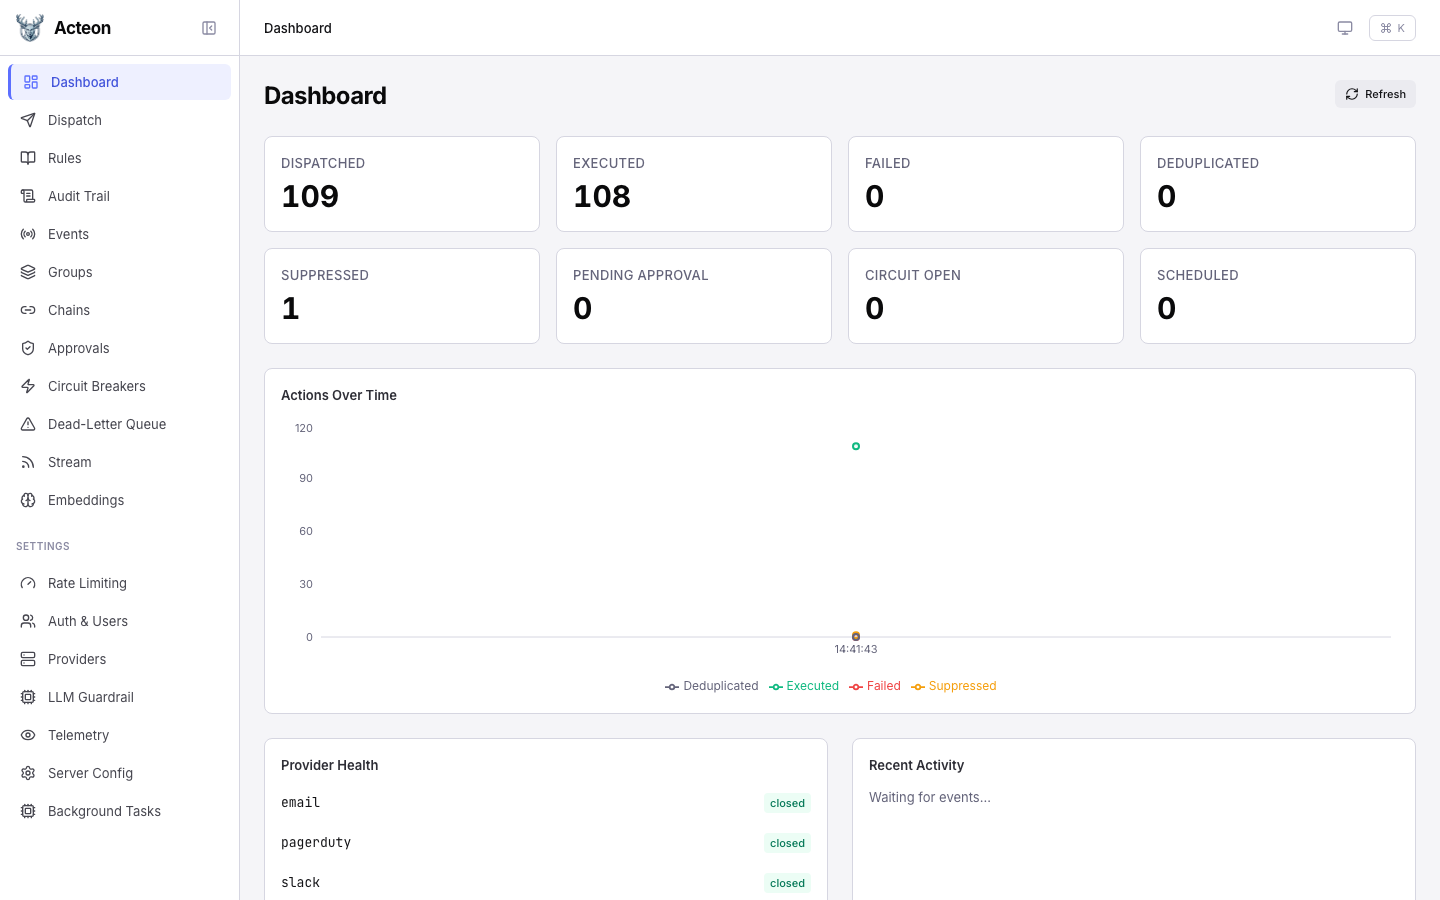
Metric Cards
The top section displays key counters that update on every refresh:
| Metric | Description |
|---|---|
| Dispatched | Total actions received by the gateway |
| Executed | Actions successfully sent to a provider |
| Failed | Actions that failed during execution |
| Deduplicated | Actions dropped by deduplication rules |
| Suppressed | Actions blocked by suppression rules |
| Pending Approval | Actions waiting for human approval |
| Circuit Open | Number of circuit breakers currently open |
| Scheduled | Actions waiting for their scheduled start time |
Click any metric card to navigate to the relevant detail page (e.g., clicking Suppressed takes you to the Audit Trail filtered by suppressed outcomes).
Actions Over Time
A time-series chart shows action throughput broken down by outcome category:
- Executed (green) -- successfully delivered actions
- Deduplicated (gray) -- actions dropped by dedup rules
- Failed (red) -- execution failures
- Suppressed (amber) -- actions blocked by rules
The chart auto-refreshes with the dashboard polling interval.
Provider Health
The bottom-left panel shows registered providers and their current circuit breaker state:
- closed -- normal operation
- open -- circuit tripped, actions are rejected or routed to fallback
- half_open -- recovery probe in progress
Recent Activity
The bottom-right panel shows a live feed of dispatched events via Server-Sent Events (SSE). Events appear as they flow through the gateway.
Refresh
Click the Refresh button in the top-right corner to manually reload all dashboard data. The dashboard also auto-refreshes every 15 seconds.