Operations
The operations pages let you interact with the gateway: dispatching actions, inspecting rules, browsing the audit trail, managing approvals, and monitoring chains.
Alerting
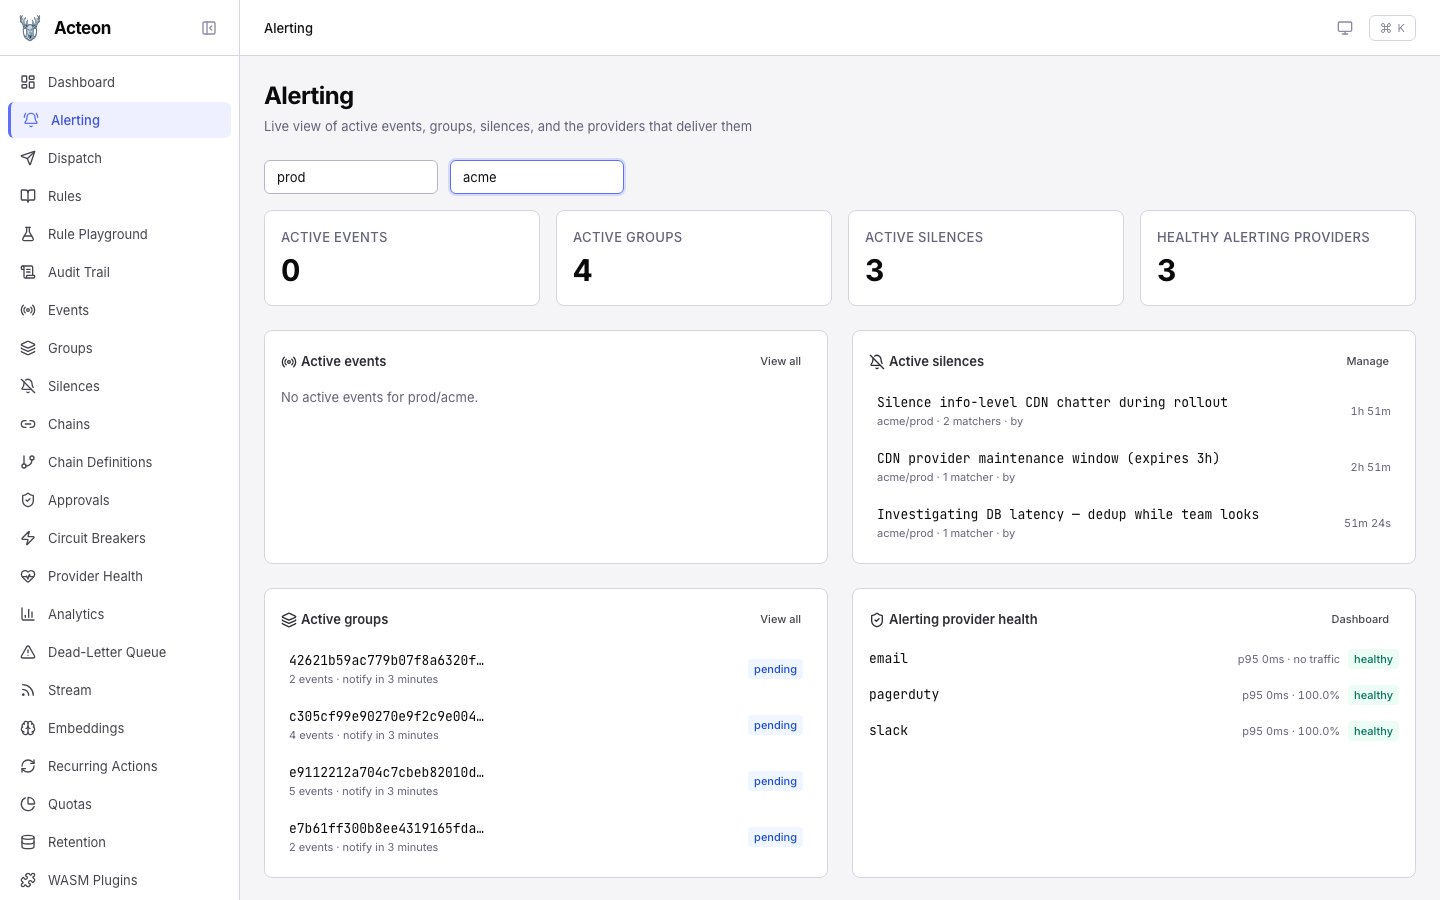
The Alerting page is a unified command center for on-call workflows. It surfaces the four alerting primitives that would otherwise live on separate pages in a single view.
At the top, enter a namespace and tenant to scope the events and groups cards (silences and provider health load without filters). Four stat cards summarize the current state, and the panels below expand each one into a live list. The screenshot above shows the prod / acme scope with:
- 0 active events — the empty state, because no
state_machinerule is matching this namespace/tenant. When the lifecycle is tracked, this card fills with firing events and a state badge per row. - 4 active groups — the
group-alerts-by-servicerule has batched incoming alerts into 4 pending groups (checkout-api: 5 events, payment-service: 4 events, auth-service: 2 events, events-consumer: 2 events). Each row links through to the Groups page. - 3 active silences — CDN provider maintenance window, an
info-level CDN chatter silence (regex), and a "postgres-primary investigating" silence. Each row shows the matcher count, who created it, and a countdown to its end time. - 3 healthy alerting providers —
email,pagerduty,slack, all reportingclosedcircuit breakers, with p95 latency and success-rate rollups from the provider metrics snapshot.
Panel contents
| Card | Data source | Filter scope | Empty state |
|---|---|---|---|
| Active events | GET /v1/events | Requires namespace + tenant | "Enter a namespace and tenant to load active events" |
| Active groups | GET /v1/groups | Requires namespace + tenant | "Enter a namespace and tenant to load active groups" |
| Active silences | GET /v1/silences | Auto-injects single-tenant scope; otherwise filters post-hoc to the caller's tenant grants | "No active silences" |
| Alerting provider health | GET /v1/providers/health | Filtered to known alerting provider names | Link to Settings → Providers |
What the API returns
The stat cards and lists render the same JSON the REST API emits. The active groups card maps directly from:
// GET /v1/groups?namespace=prod&tenant=acme
{
  "total": 4,
  "groups": [
    {
      "group_id": "d3e78396-ccfa-41a4-a9e3-cfa8a62f2268",
      "group_key": "e9112212a704c7cbeb82010d1917a65c0266ae72fa3037e6c6bb0629cf247ffd",
      "event_count": 5,
      "state": "pending",
      "notify_at": "2026-04-12T00:48:28.860743+00:00",
      "created_at": "2026-04-12T00:39:03.654291+00:00"
    }
    // …three more groups
  ]
}
The provider health card maps from:
// GET /v1/providers/health
{
  "providers": [
    {
      "provider": "pagerduty",
      "healthy": true,
      "circuit_breaker_state": "closed",
      "total_requests": 4,
      "successes": 4,
      "failures": 0,
      "success_rate": 100.0,
      "avg_latency_ms": 0.0515,
      "p50_latency_ms": 0.032,
      "p95_latency_ms": 0.128,
      "p99_latency_ms": 0.128
    }
    // …slack, email, etc.
  ]
}
A provider is classified as alerting-oriented when its name matches any of: opsgenie, pagerduty, victorops, splunk, pushover, telegram, wechat, slack, discord, teams, twilio, email, webhook, sns. Storage, LLM, and compute providers are intentionally hidden from this card.
Tip
Use this page as the first thing you open during an incident — it shows you which events are firing, which groups are batching them up, which silences are already in place, and whether the delivery channels are healthy.
Silences
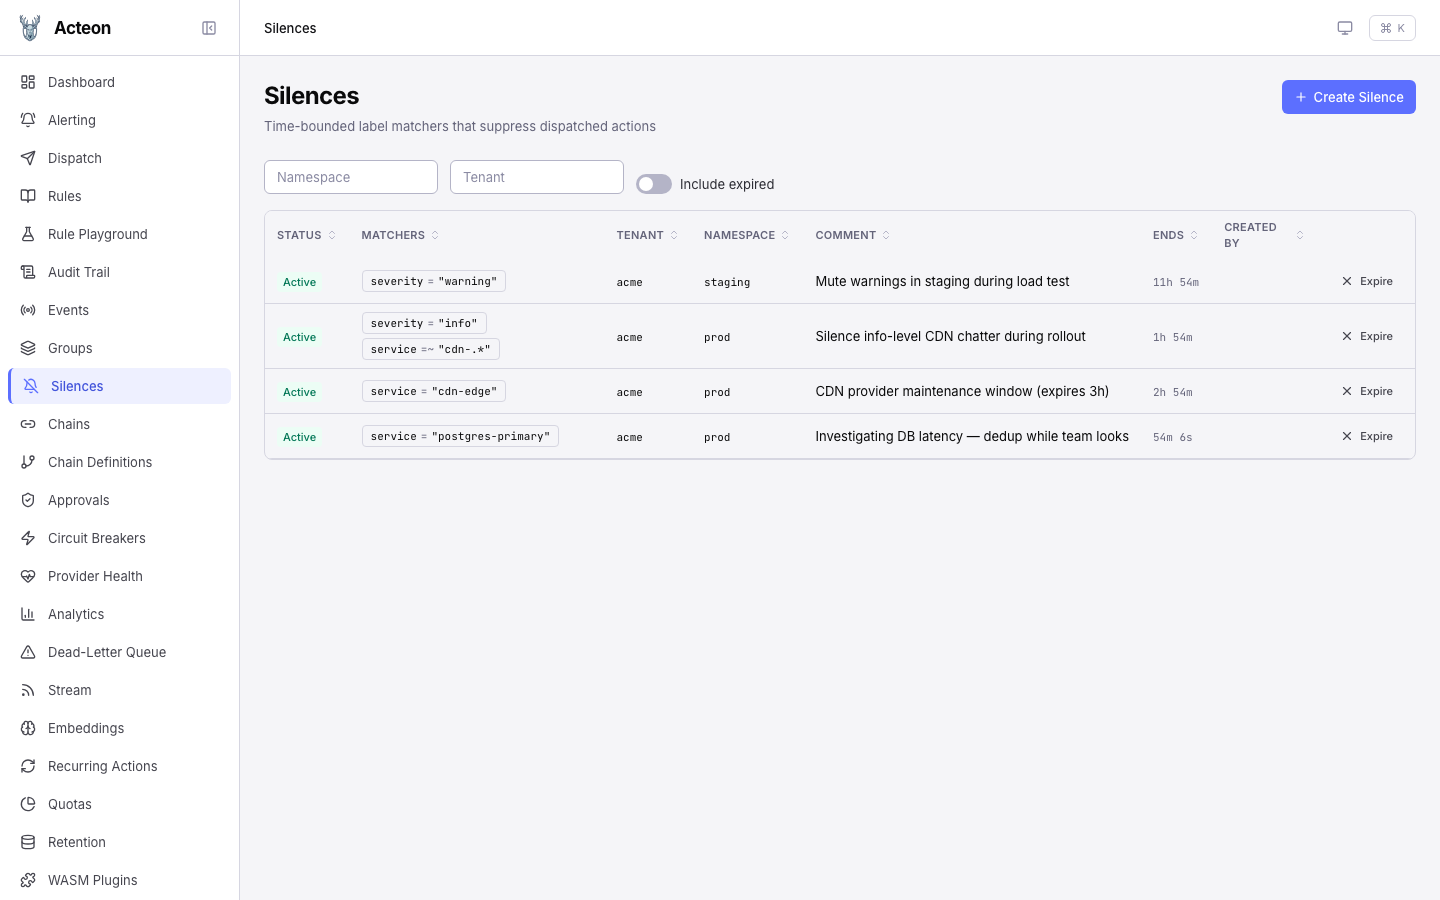
Silences are time-bounded label matchers that suppress dispatched actions during maintenance windows or incident response. The Silences page provides full CRUD against the /v1/silences REST API. The screenshot above shows 4 active silences across the prod and staging namespaces — three covering CDN / Postgres service labels for incident response, and one broad severity = warning silence in staging for a load test. Each row shows:
| Column | Description |
|---|---|
| Status | Active / Expired badge. Expired rows only appear with the Include expired toggle on. |
| Matchers | Each matcher rendered as a name op "value" pill (= / != / =~ / !~). Multiple matchers are AND-ed. |
| Tenant / Namespace | Scope the silence applies to. Hierarchical — a silence on acme covers acme.us-east. |
| Comment | Free-form text recorded at creation; shown in audit records when the silence intercepts a dispatch. |
| Ends | Countdown to end time for active silences, relative timestamp for expired. |
| Created by | Identity of the caller that created the silence (from the auth context). |
Click the Expire action on any row for immediate soft-expire, or click the row itself to open the detail drawer, where you can extend the silence by any number of additional minutes — the new end time is anchored to the current ends_at (not to now), so extending a silence with 8h left by "60 minutes" gives you 9h, not 1h.
Creating a silence
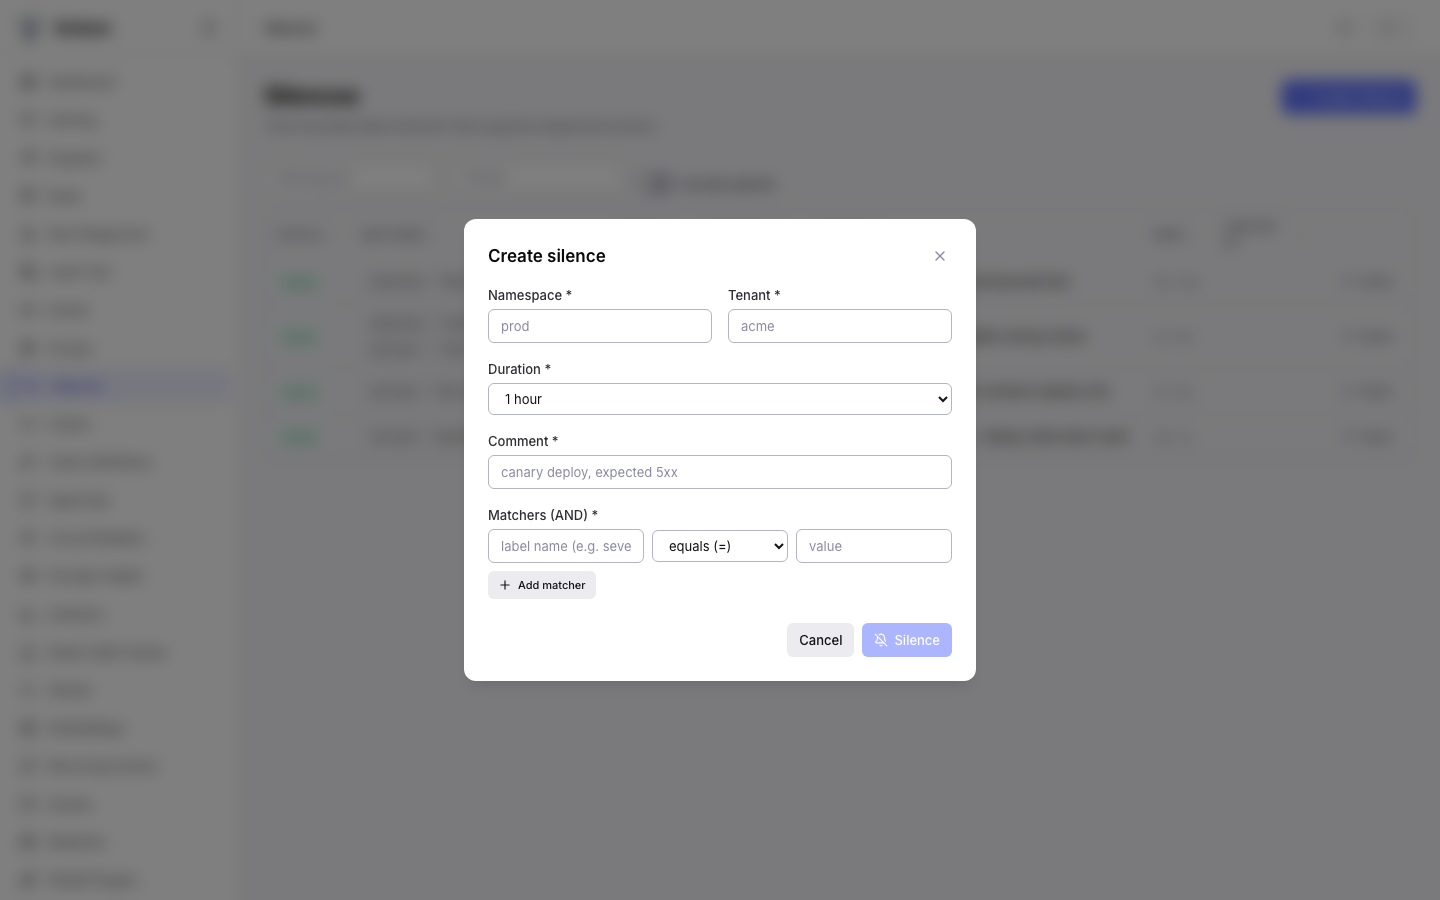
The Create Silence modal covers the full create flow in one pass:
| Field | Required | Notes |
|---|---|---|
| Namespace | Yes | Logical grouping; must be covered by the caller's grants. |
| Tenant | Yes | Tenant the silence applies to. Hierarchical — see above. |
| Duration | Yes | Preset dropdown: 15 minutes, 1 hour, 2 hours, 4 hours, 8 hours, 1 day, 1 week. Sent as duration_seconds; the backend computes ends_at = starts_at + duration. |
| Comment | Yes | Required for audit-trail context. Shown in the list and in audit records referencing the silence. |
| Matchers | Yes (≥1) | Each row is a {name, op, value} triple. Click Add matcher to AND another matcher onto the silence. Regex matchers are capped at 256 characters and 64 KB compiled DFA to prevent ReDoS. |
The request body matches the /v1/silences POST shape exactly:
// POST /v1/silences
{
  "namespace": "prod",
  "tenant": "acme",
  "matchers": [
    { "name": "service", "op": "regex", "value": "cdn-.*" },
    { "name": "severity", "op": "equal", "value": "info" }
  ],
  "duration_seconds": 7200,
  "comment": "Silence info-level CDN chatter during rollout"
}
And the response — which is what the row in the list view is populated from:
{
  "id": "019d7f1e-774b-7020-818f-339f243b4089",
  "namespace": "prod",
  "tenant": "acme",
  "matchers": [
    { "name": "service", "op": "regex", "value": "cdn-.*" },
    { "name": "severity", "op": "equal", "value": "info" }
  ],
  "starts_at": "2026-04-12T00:36:36.297488Z",
  "ends_at":   "2026-04-12T02:36:36.297488Z",
  "created_by": "operator@acme.example",
  "comment": "Silence info-level CDN chatter during rollout",
  "created_at": "2026-04-12T00:36:36.297488Z",
  "updated_at": "2026-04-12T00:36:36.297488Z",
  "active": true
}
Matchers are immutable
The extend / edit flow only changes ends_at and comment. To change matchers you must expire the silence and create a new one. This keeps audit trail references stable — an action suppressed by silence 019d7f1e-… will always resolve back to the same matcher set.
See Silences for the matcher semantics, regex limits, and HA sync timing.
Dispatch
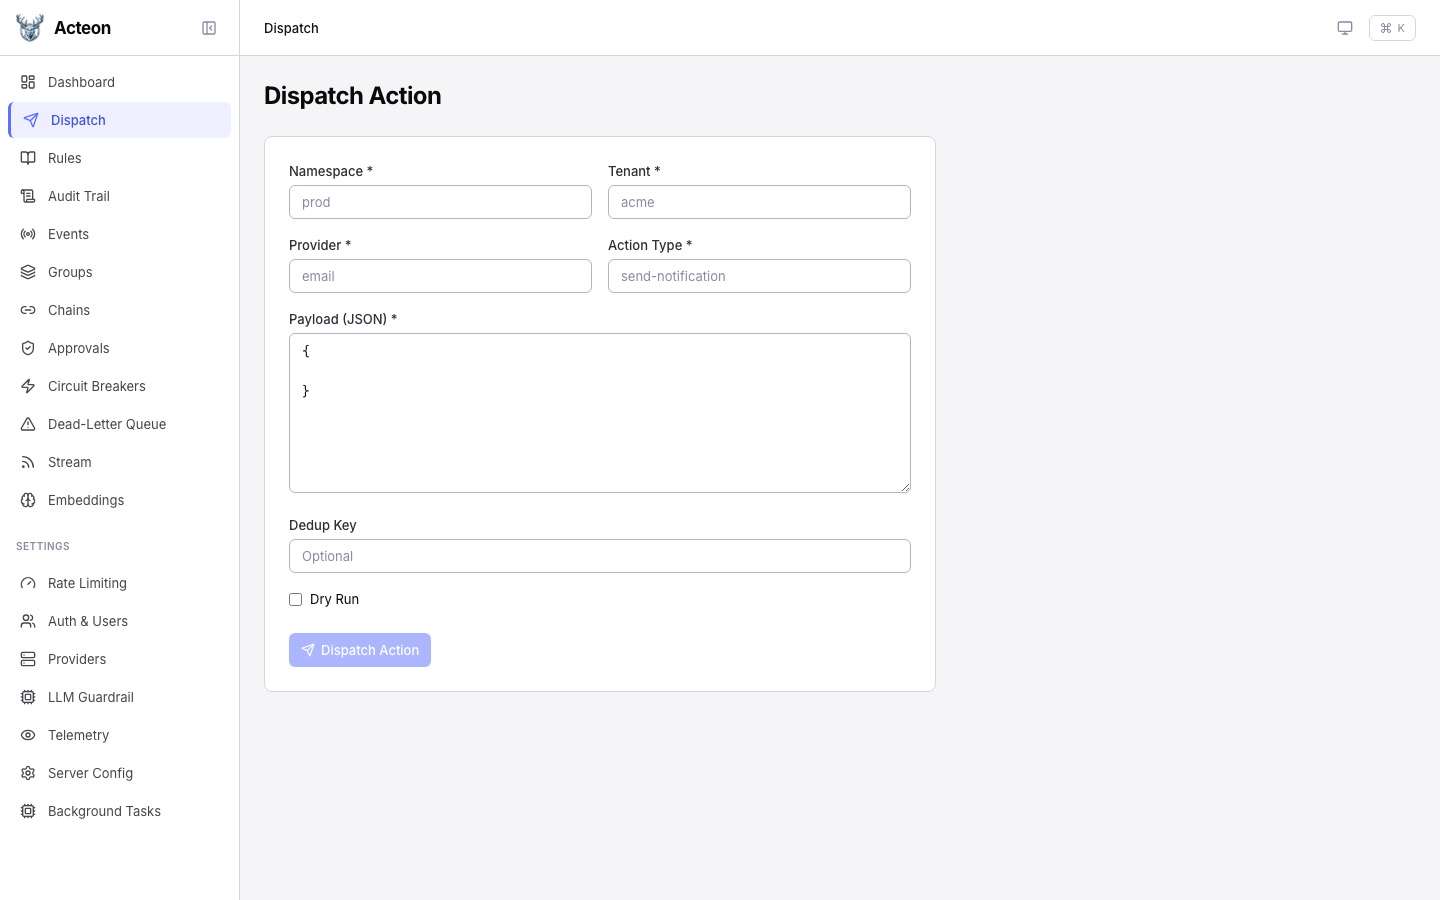
Send actions through the gateway directly from the UI. Fill in the required fields and click Dispatch.
| Field | Required | Description |
|---|---|---|
| Namespace | Yes | Logical grouping for the action |
| Tenant | Yes | Tenant identifier |
| Provider | Yes | Target provider name |
| Action Type | Yes | Type of action to dispatch |
| Payload | Yes | JSON payload body |
| Dedup Key | No | Deduplication key |
| Fingerprint | No | Event fingerprint for state machines |
| Dry Run | No | Toggle to simulate without executing |
Tip
Enable Dry Run to test rule evaluation without actually sending the action to a provider. The response shows what would happen.
Rule Playground
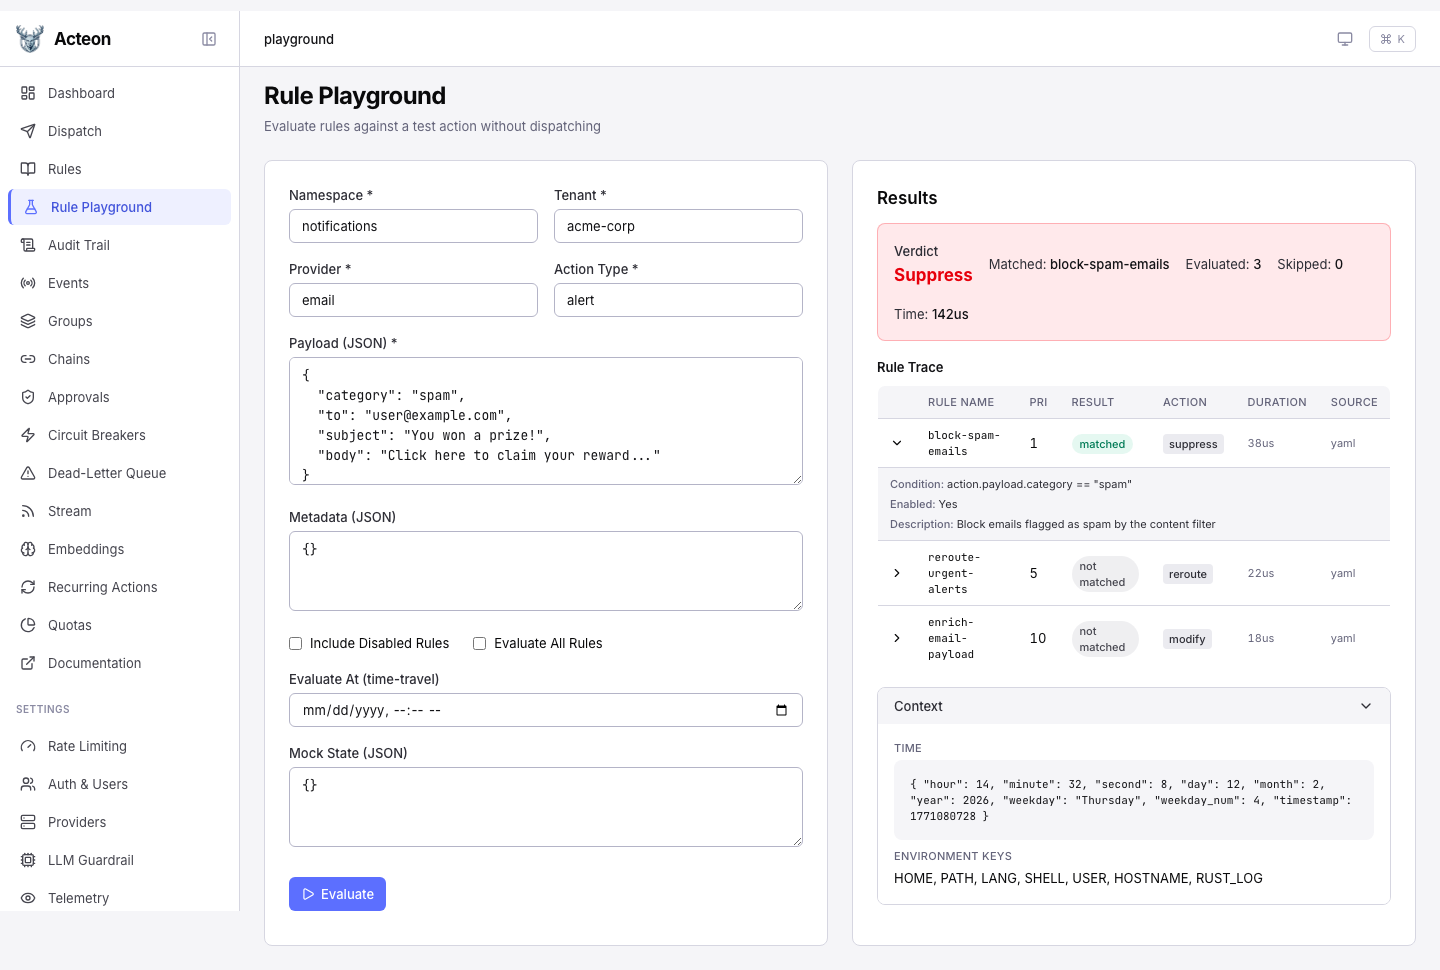
Test how rules evaluate against a synthetic action without dispatching. The playground shows a per-rule trace with verdict, match result, timing, and condition details.
- Evaluate All -- force evaluation of every rule, even after the first match
- Include Disabled -- show disabled rules as skipped entries in the trace
- Time-Travel -- override the evaluation clock for time-sensitive rules
- Mock State -- provide state key overrides for state-dependent conditions
- Modified Payload -- when the verdict is
modify, preview the resulting payload
See Rule Playground for full documentation.
Rules
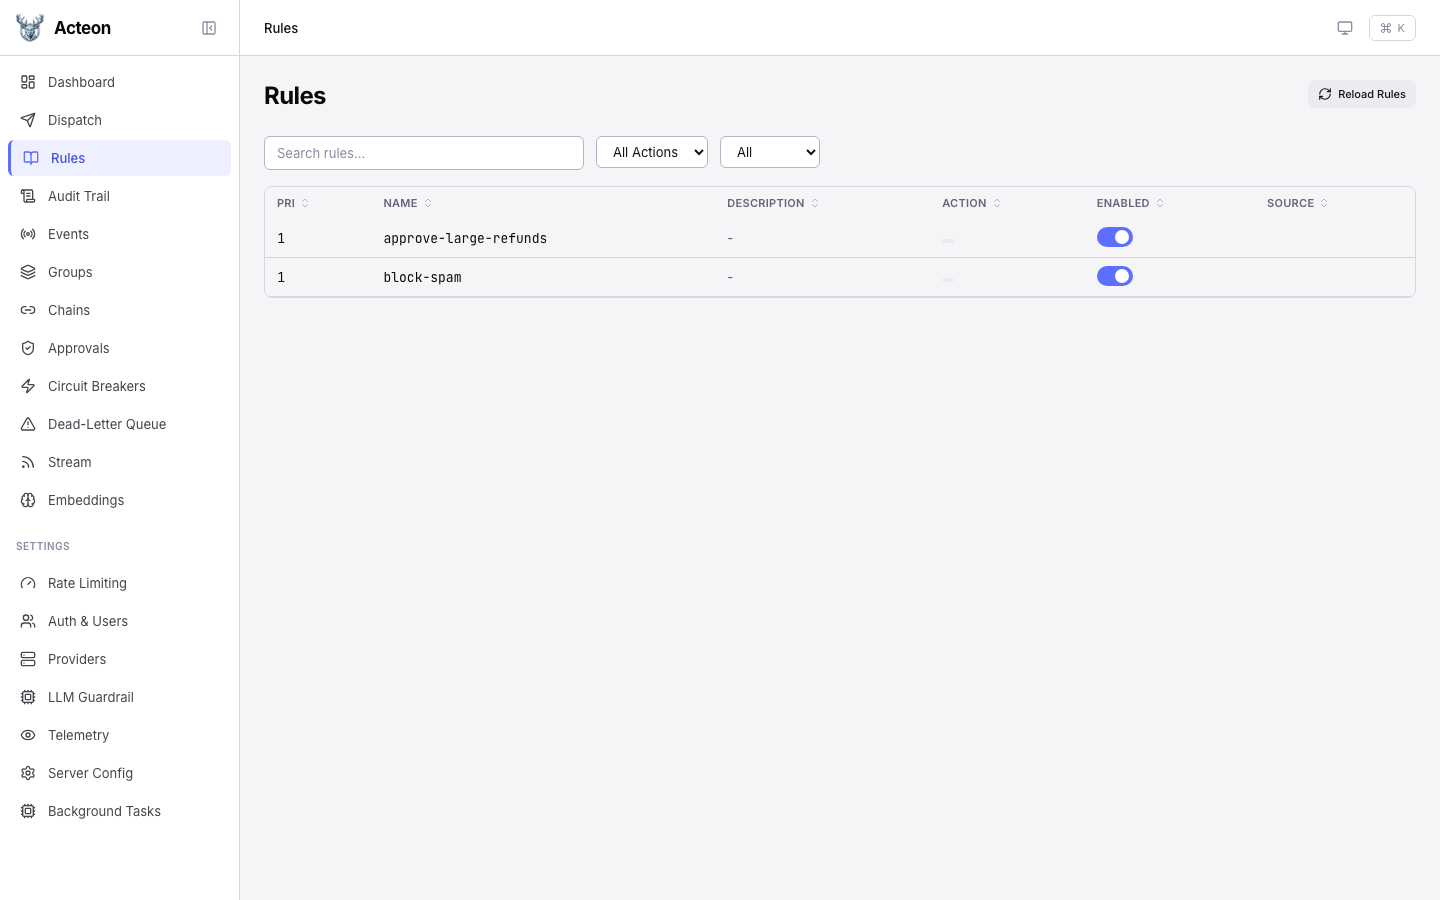
Browse all loaded rules with their priority, action type, and enabled status. The rules page provides:
- Search -- filter rules by name
- Filter by source -- YAML, CEL, or API-defined rules
- Filter by action type -- show only rules matching a specific type
- Reload -- click the reload button to re-read rules from disk
Audit Trail
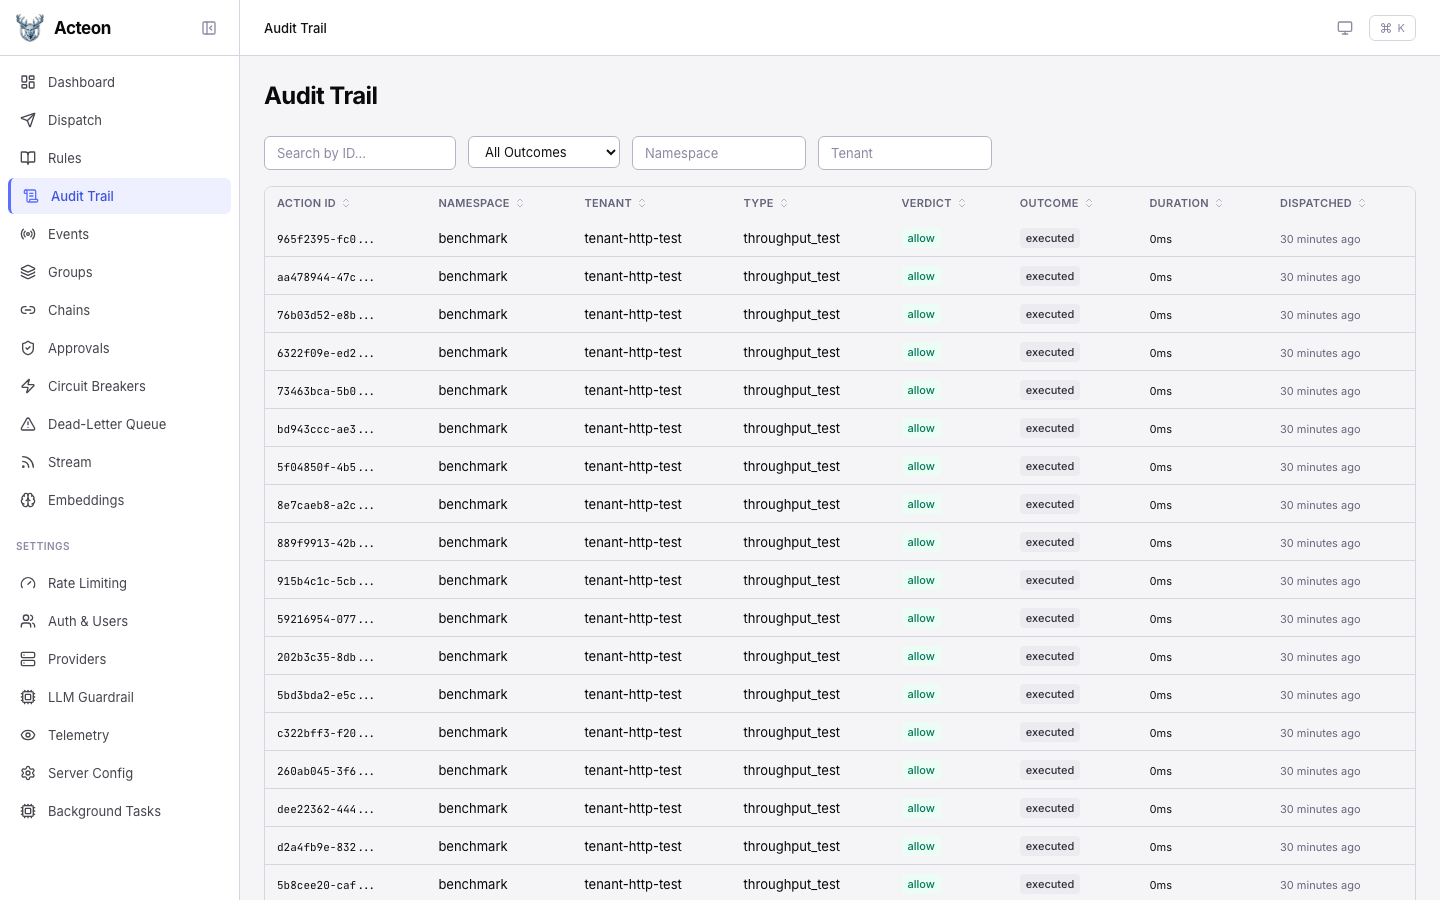
The audit trail shows a paginated, filterable log of every action and its outcome.
Filters
- Namespace, Tenant, Provider, Action Type -- text filters
- Outcome -- filter by executed, suppressed, deduplicated, failed, etc.
- Verdict -- filter by the rule verdict (allow, suppress, etc.)
- Date range -- filter by dispatch time
Detail Drawer
Click any audit row to open a detail drawer showing:
- Full action metadata and timing
- Rule verdict and matched rule name
- Outcome details and provider response
- Action payload (if stored)
- Replay button to re-dispatch the same action
Chains
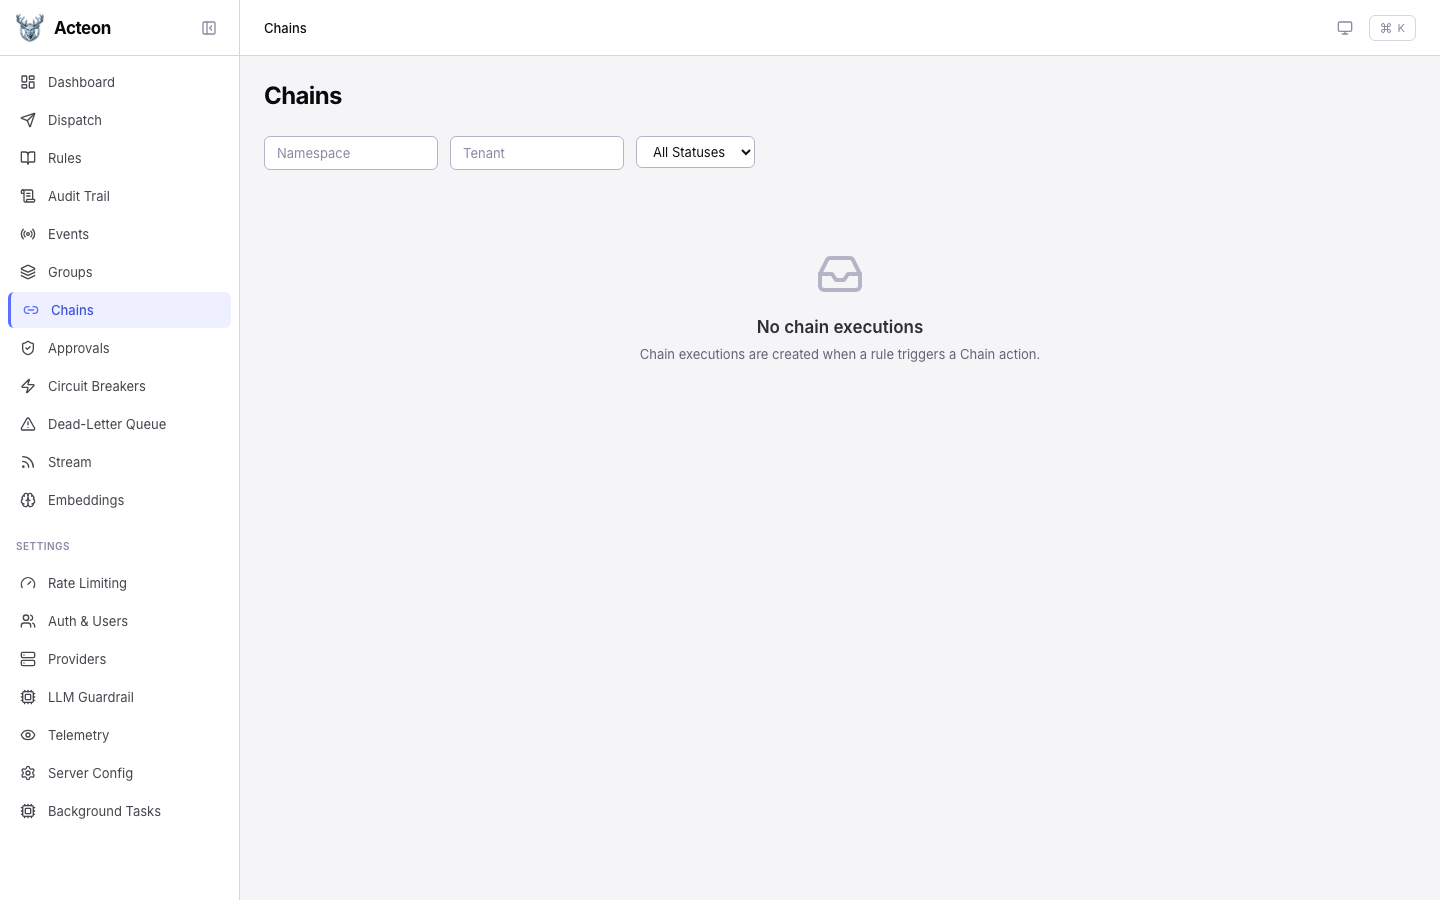
Monitor active and completed task chains. The chain list shows:
- Chain name and ID
- Current step progress
- Status (running, completed, failed, cancelled)
- Timing information
Click a chain to view step-by-step execution details, including per-step status, response data, and the execution path for branching chains.
Approvals
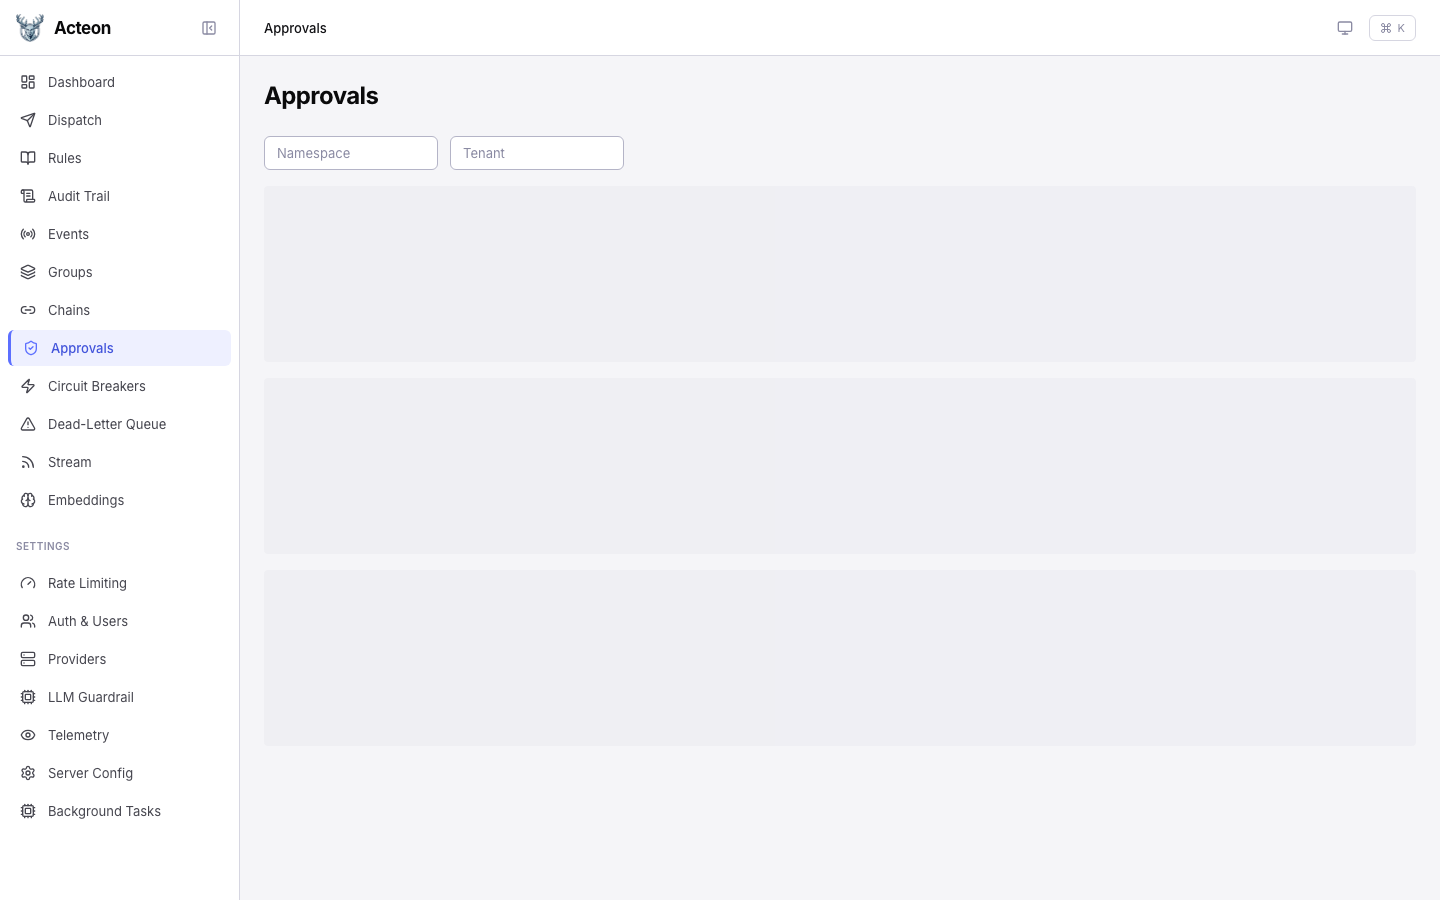
Review pending human approval requests. Each approval card shows:
- The action that triggered the approval
- Which rule required approval
- Expiration countdown
- Approve and Reject buttons
Circuit Breakers
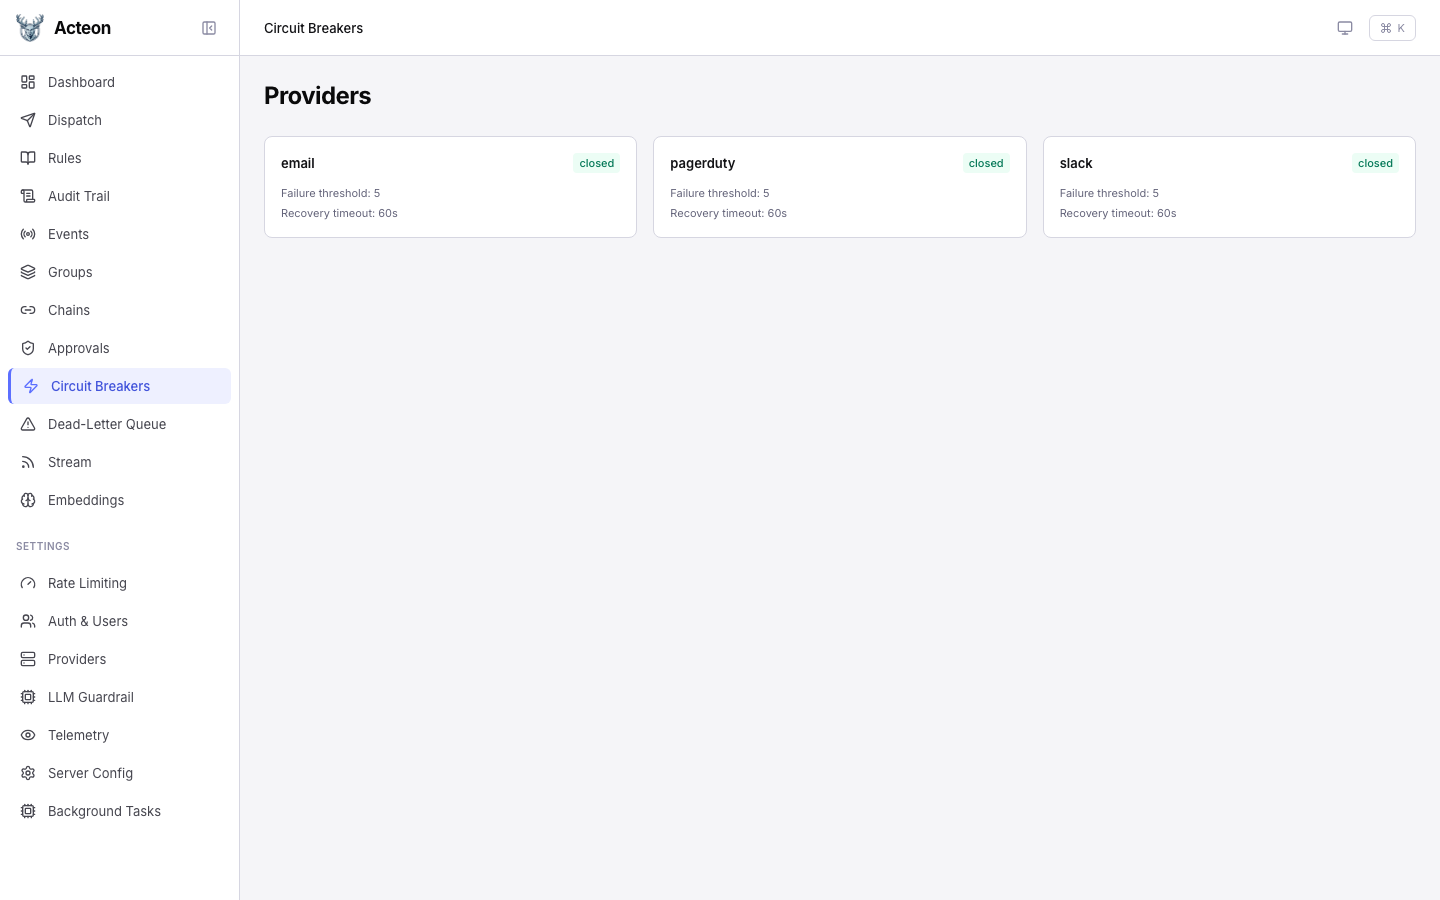
View registered providers and their circuit breaker states. Click a provider card to open a detail drawer where you can:
- View circuit breaker thresholds and recovery timeout
- Trip -- force-open the circuit (rejects all actions)
- Reset -- force-close the circuit (resume normal operation)
Dead-Letter Queue
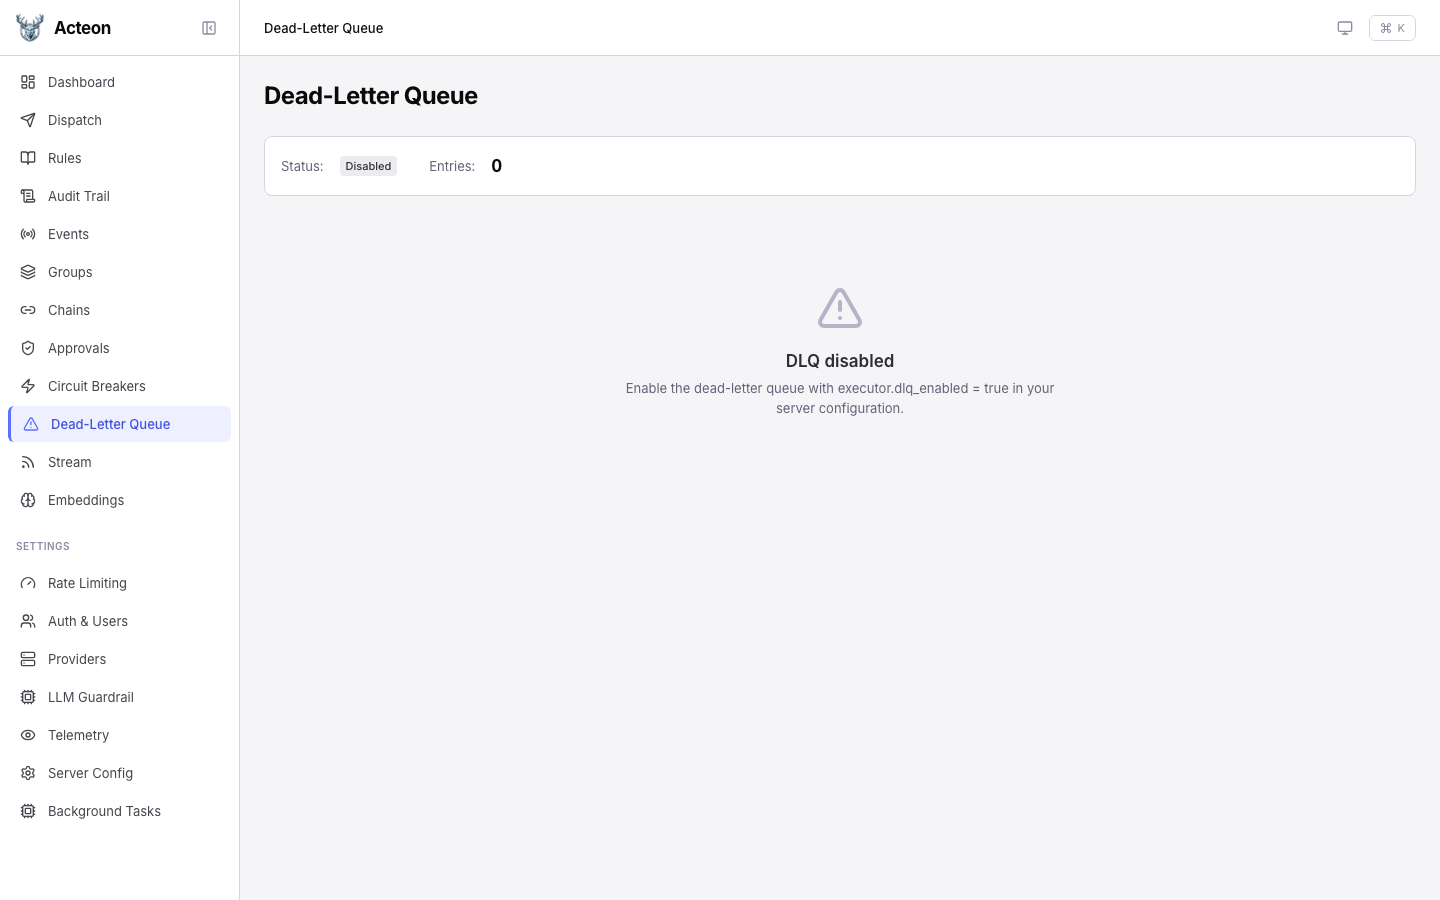
Browse actions that failed after exhausting all retries. The DLQ page lets you inspect failures and replay them.
Recurring Actions
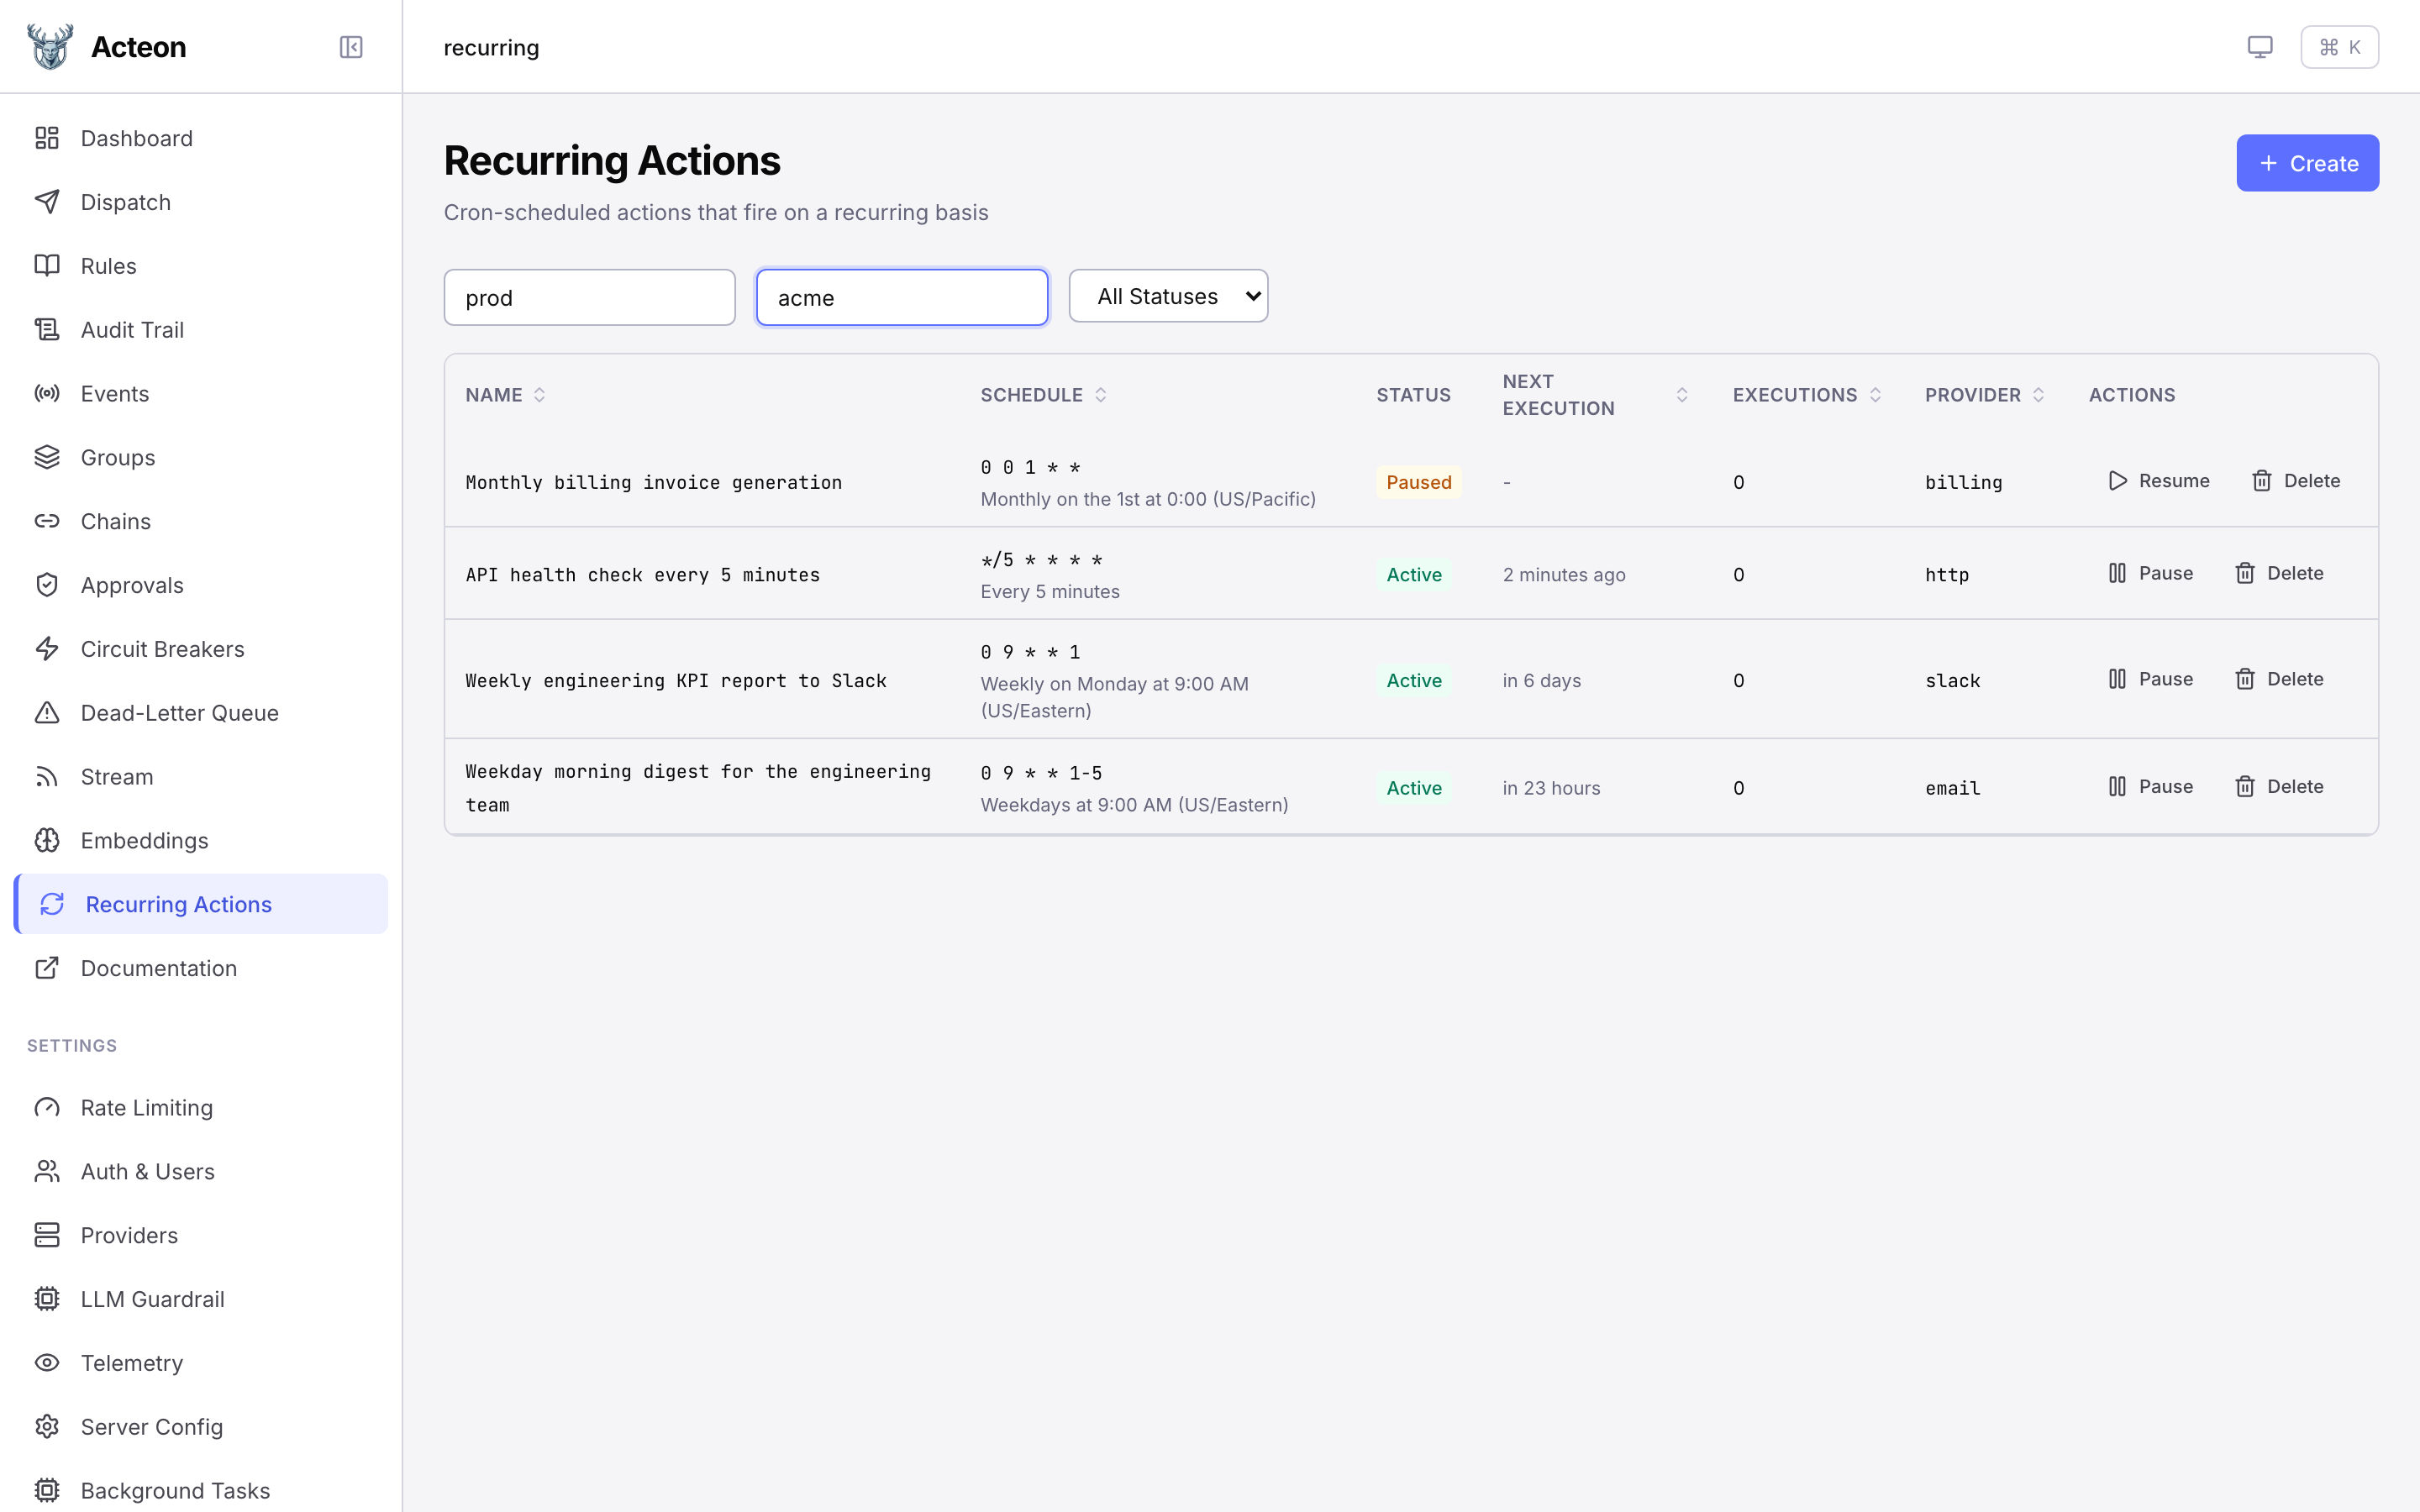
Manage recurring actions -- cron-scheduled actions that fire on a recurring basis. The list view shows all recurring actions filtered by namespace and tenant, with their schedule, status, next execution time, and execution count.
Creating a Recurring Action
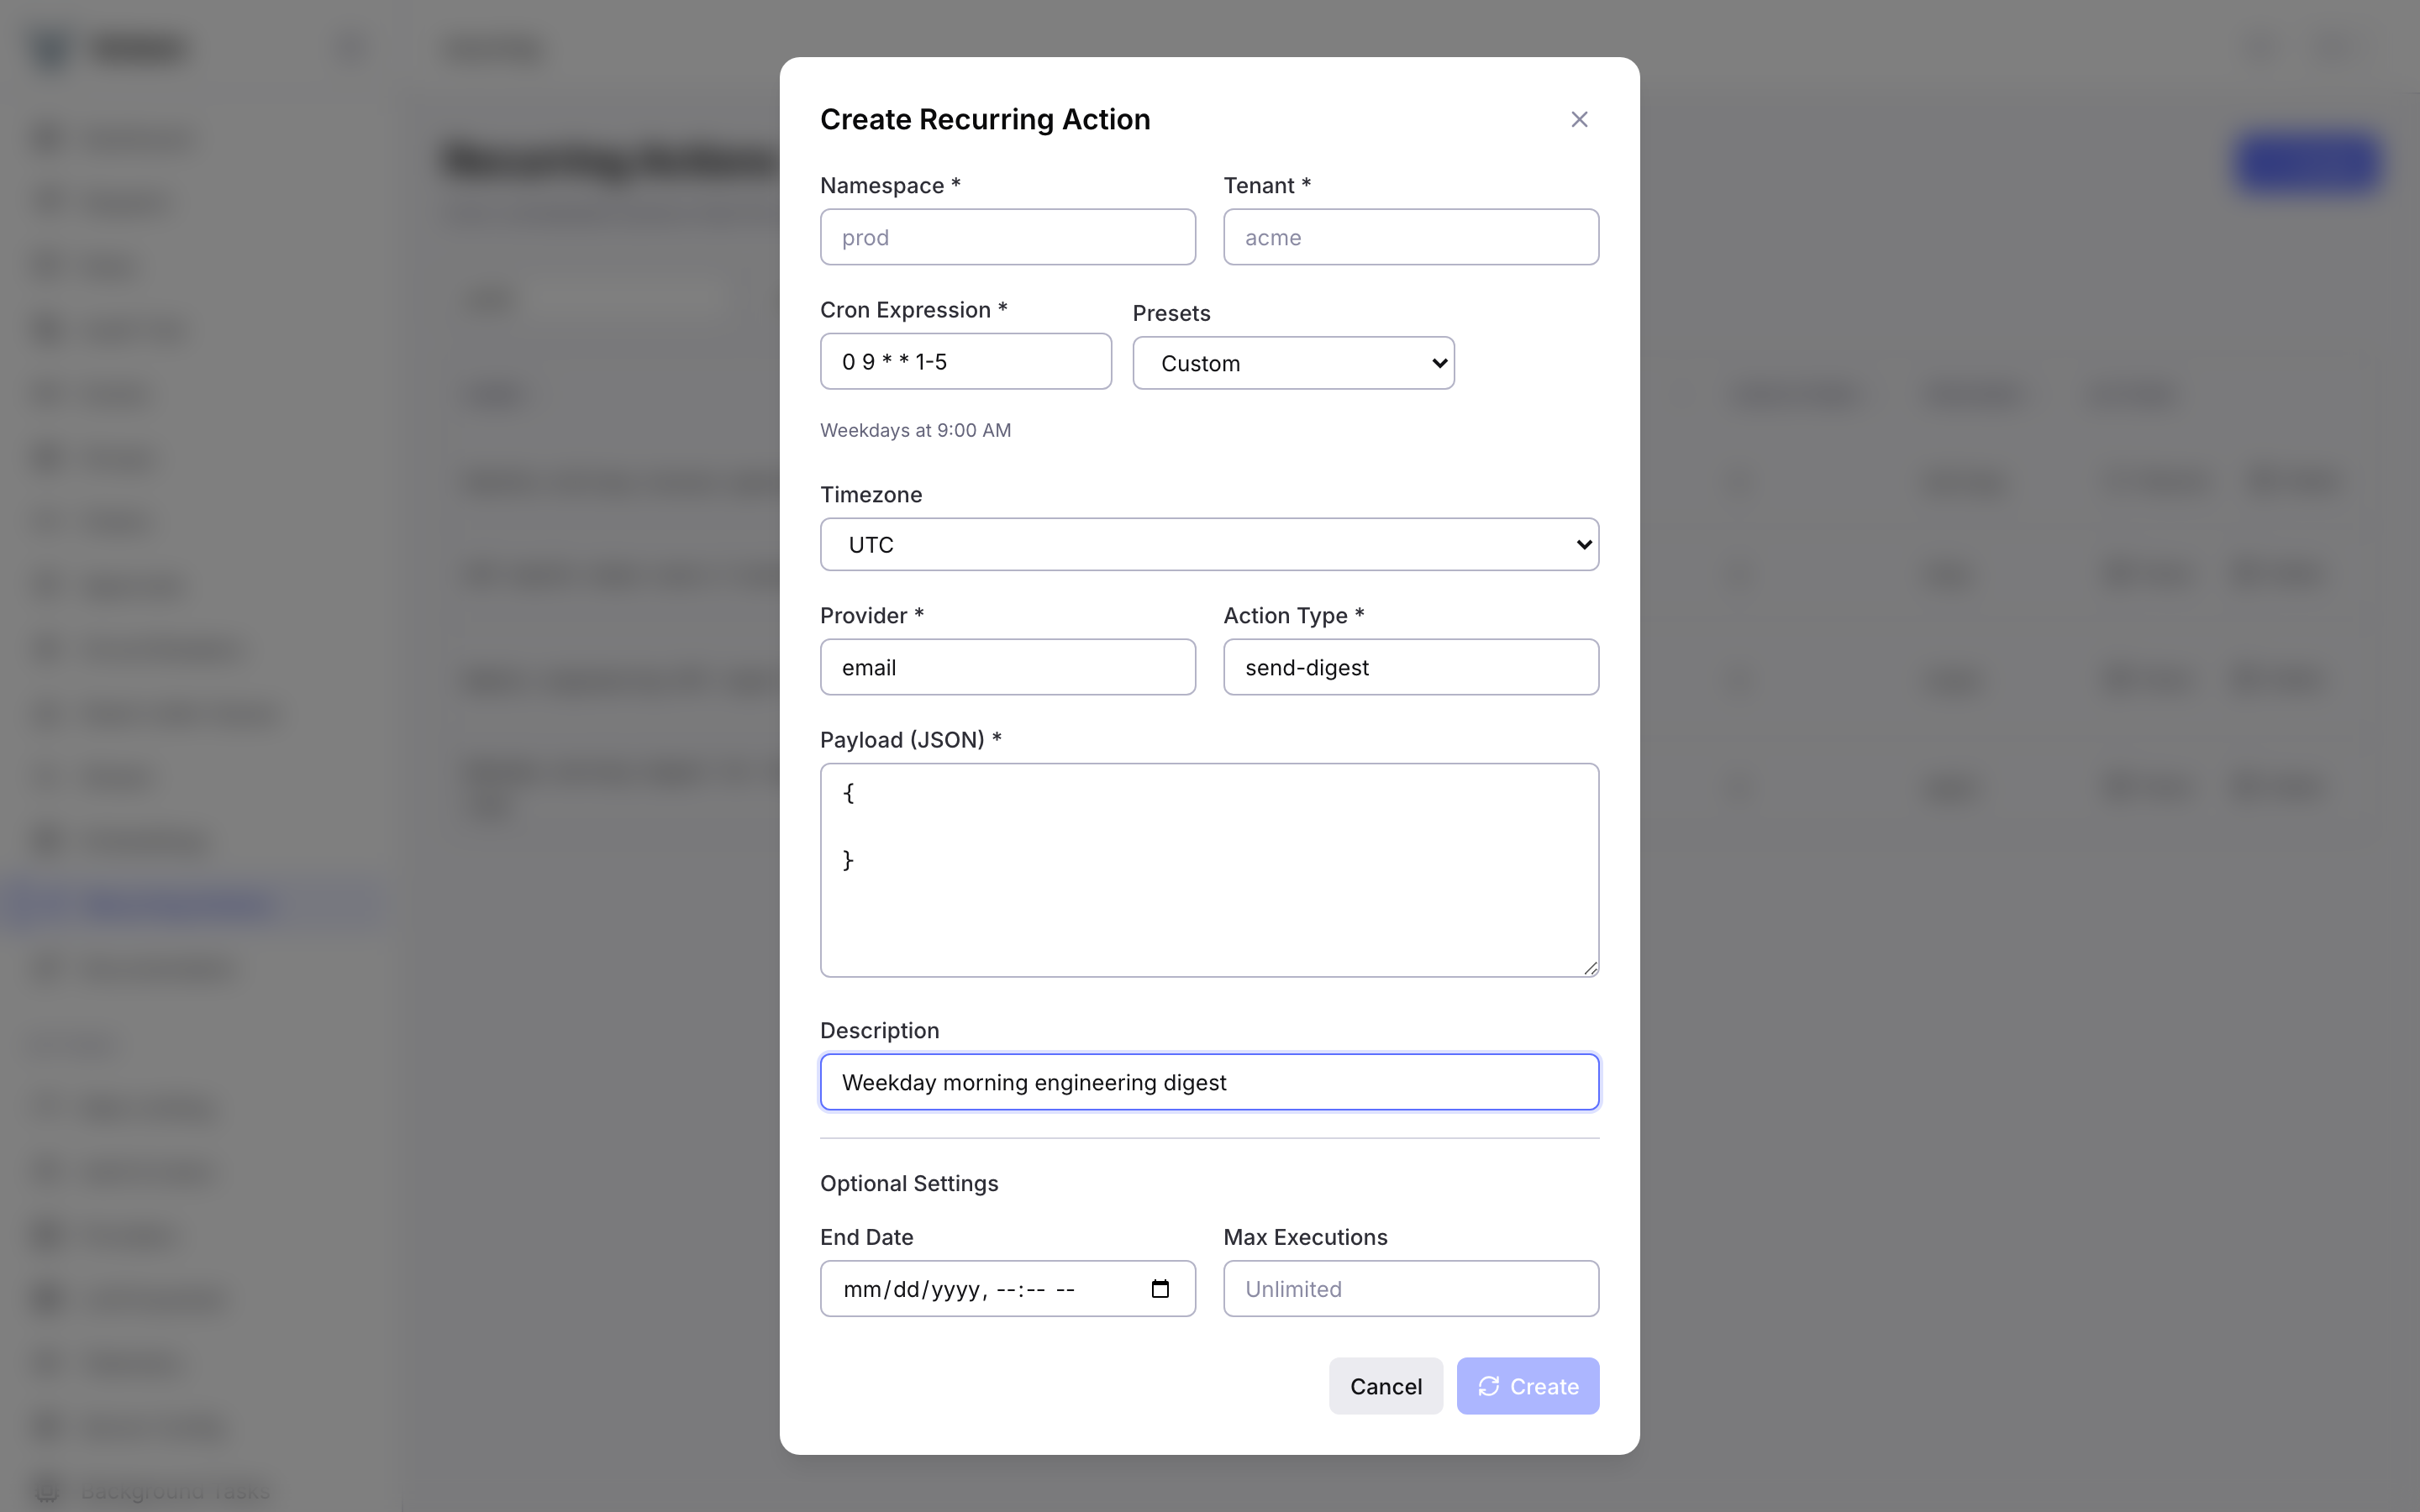
Click Create to open the creation dialog. Fill in the namespace, tenant, cron expression (with preset shortcuts), timezone, provider, action type, and JSON payload. Optional settings include a description, end date, and maximum execution limit.
Viewing Details
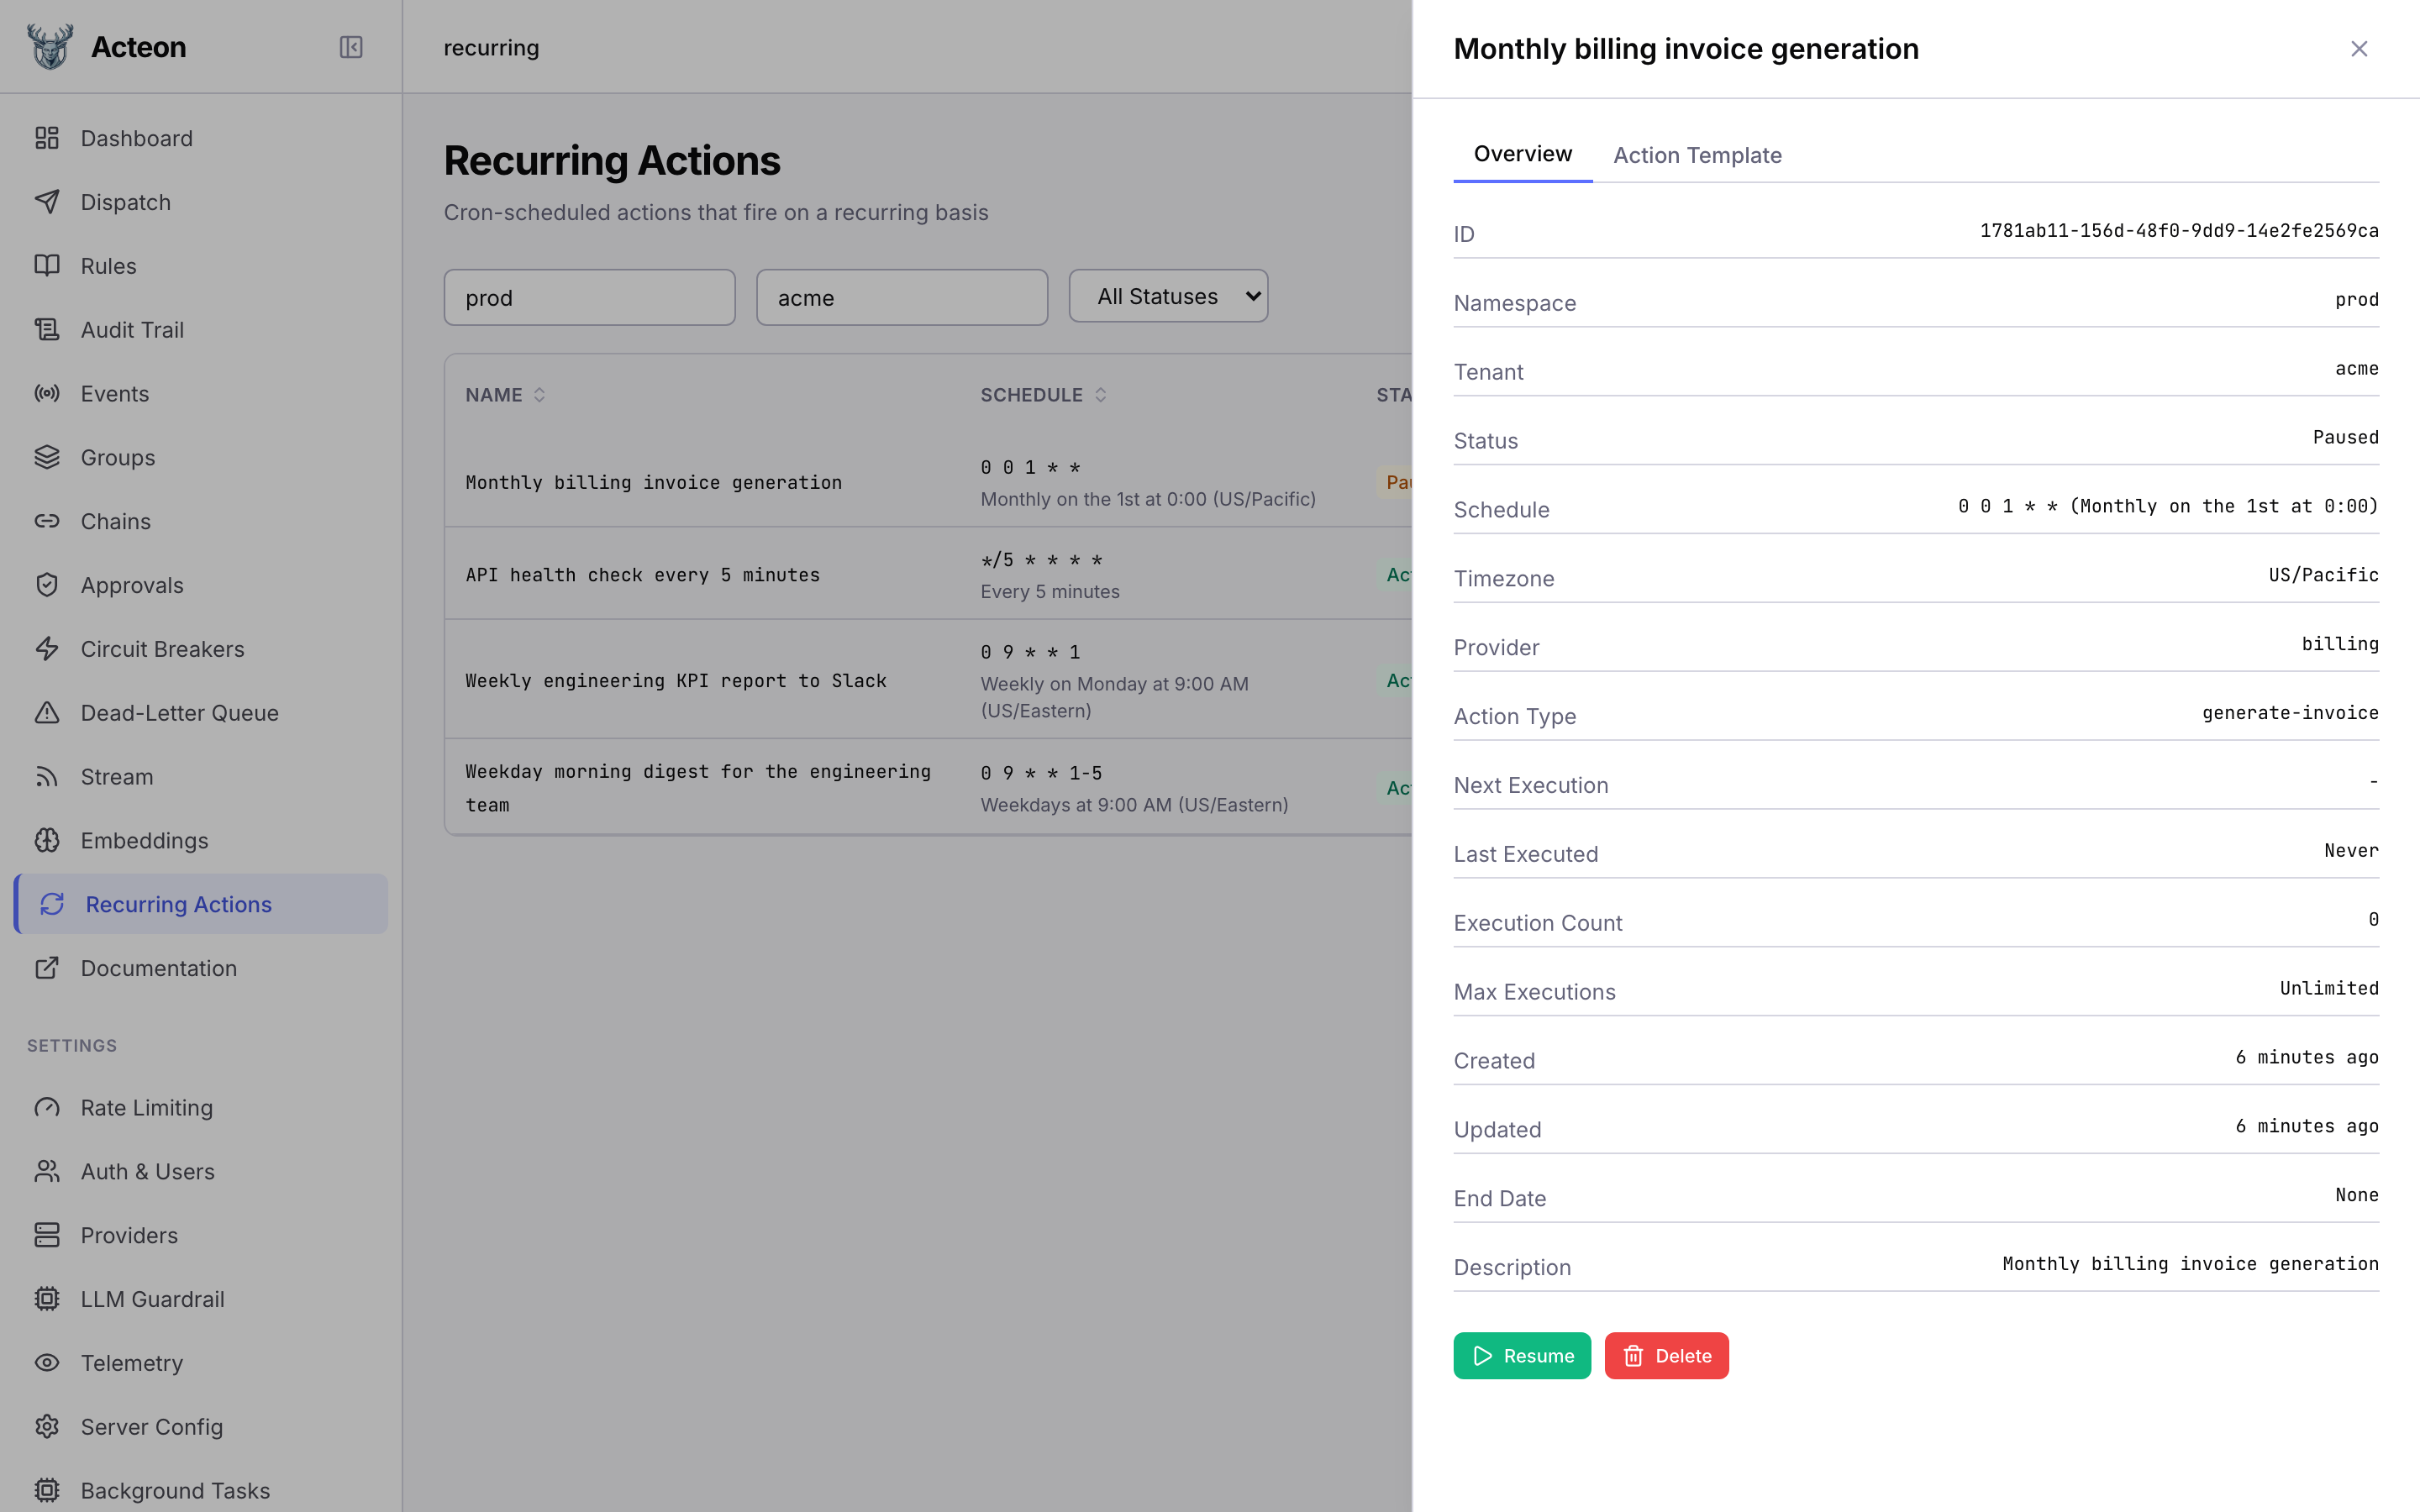
Click any row to open the detail drawer. The Overview tab shows all fields including schedule, timezone, provider, execution count, and timestamps. The Action Template tab displays the JSON payload and metadata. Use the Pause/Resume and Delete buttons to manage the action lifecycle.
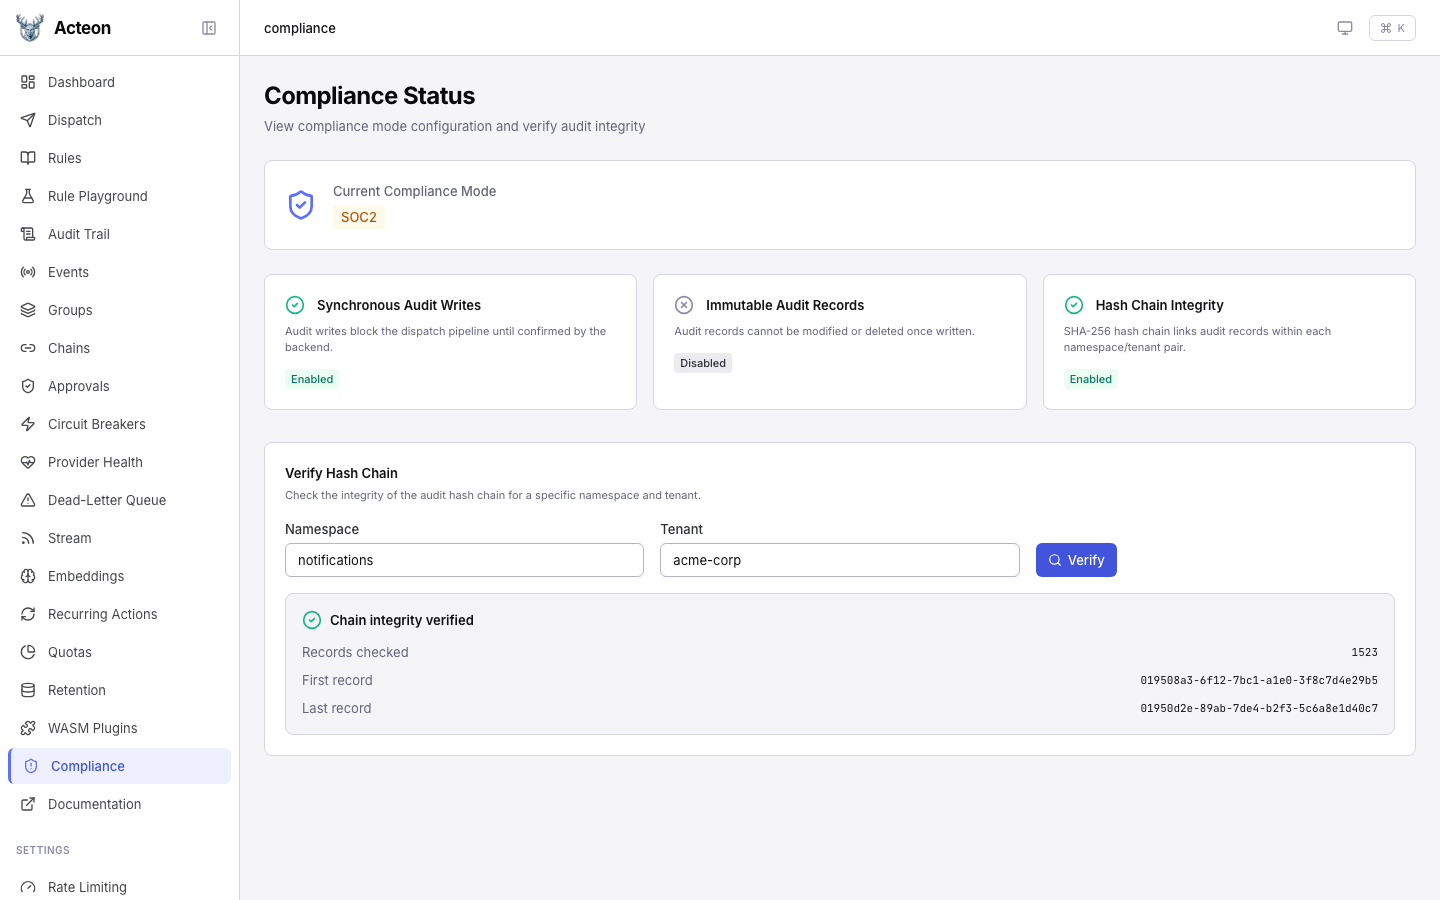
Compliance Status
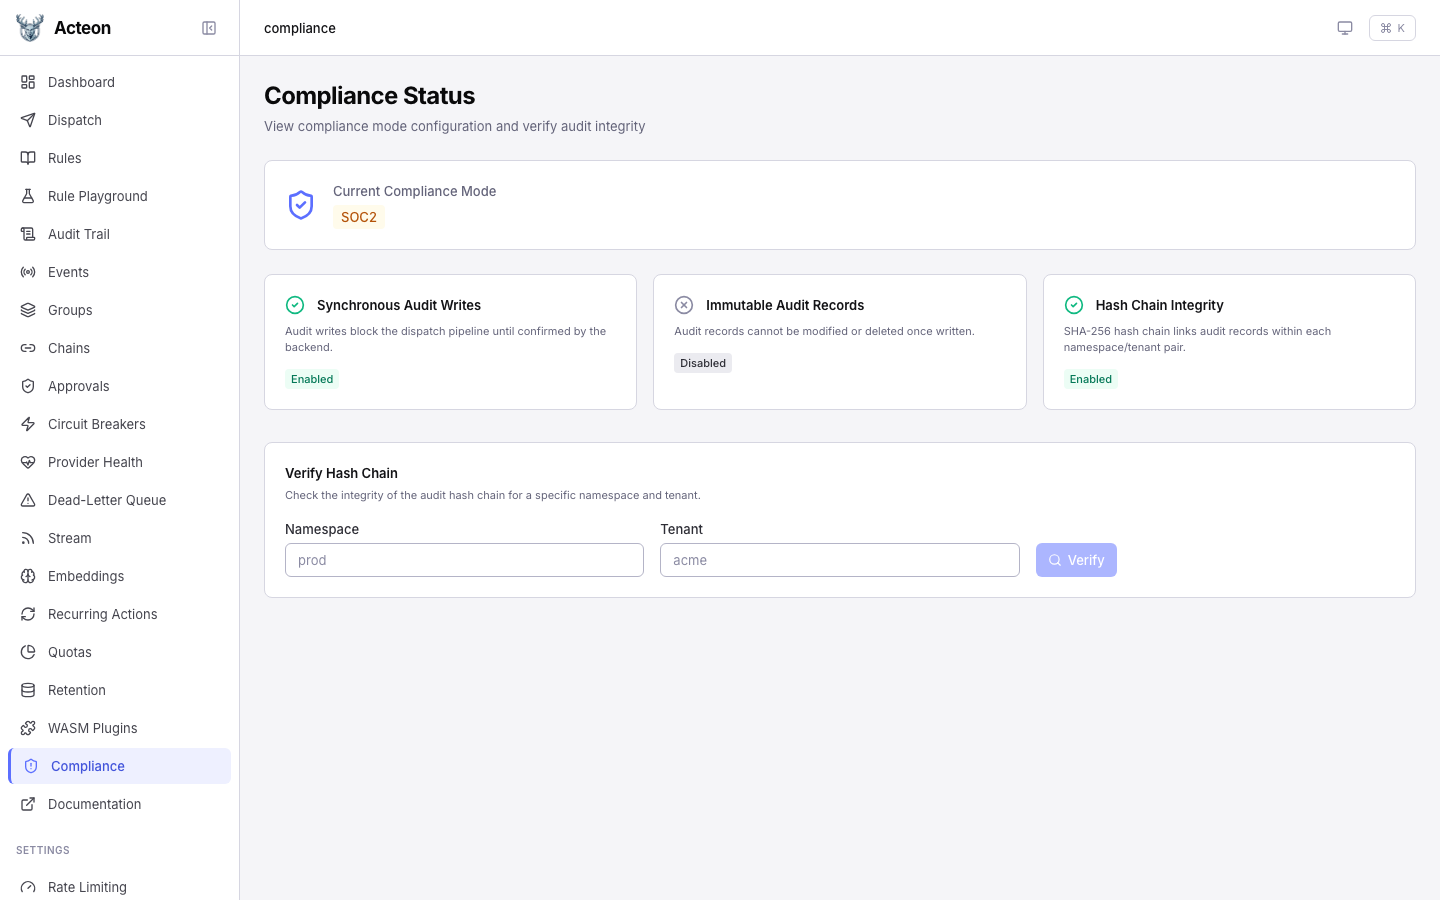
View the current compliance mode and feature status. The page shows:
- Mode badge -- the active compliance mode (SOC2, HIPAA, or None)
- Feature cards -- status of synchronous audit writes, immutable audit records, and hash chain integrity
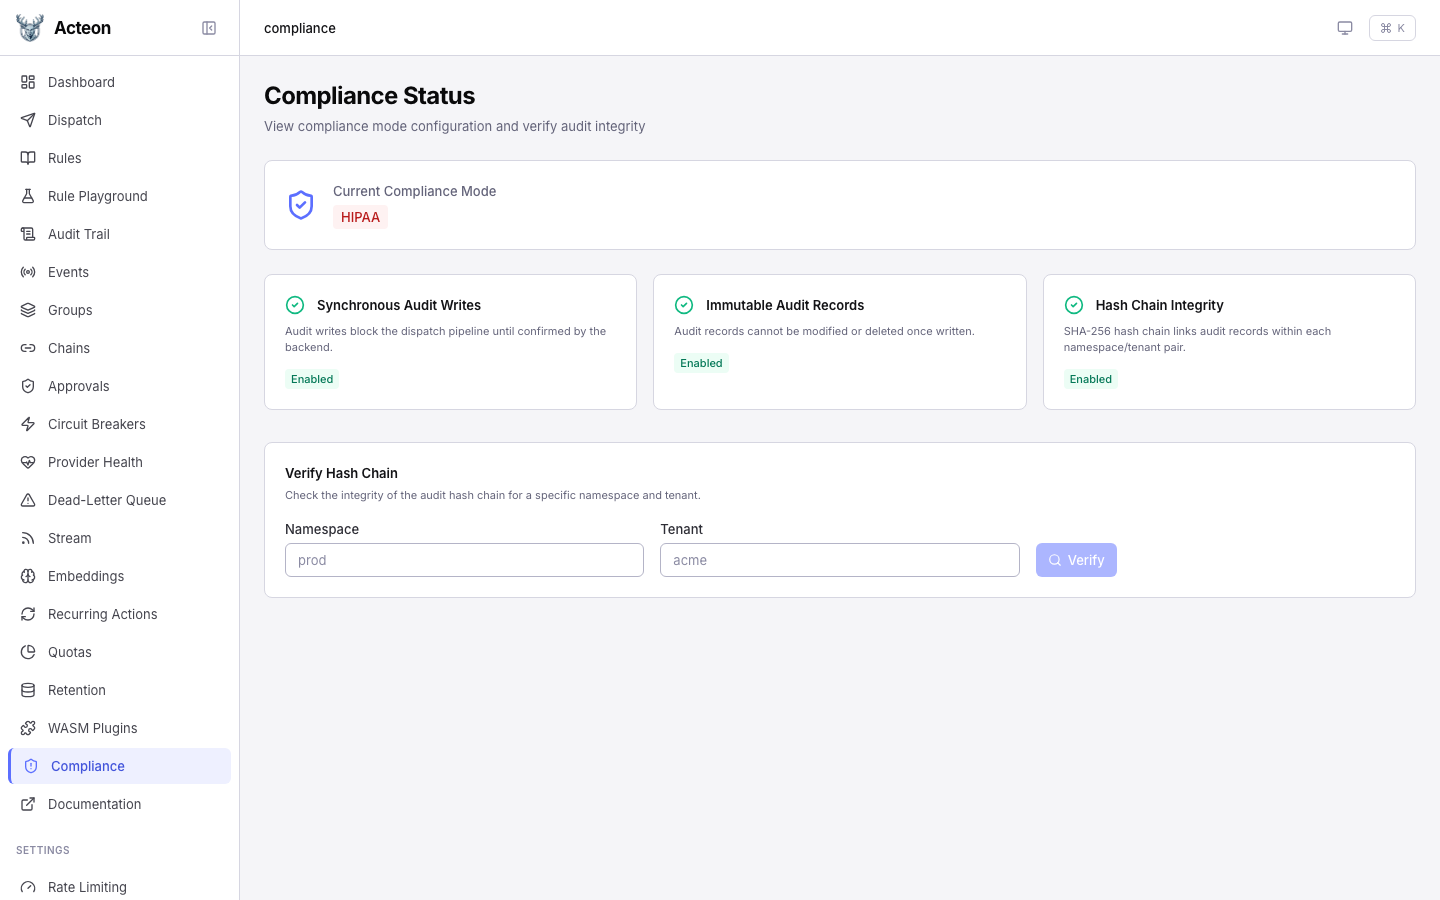
In HIPAA mode, all three features are enabled:
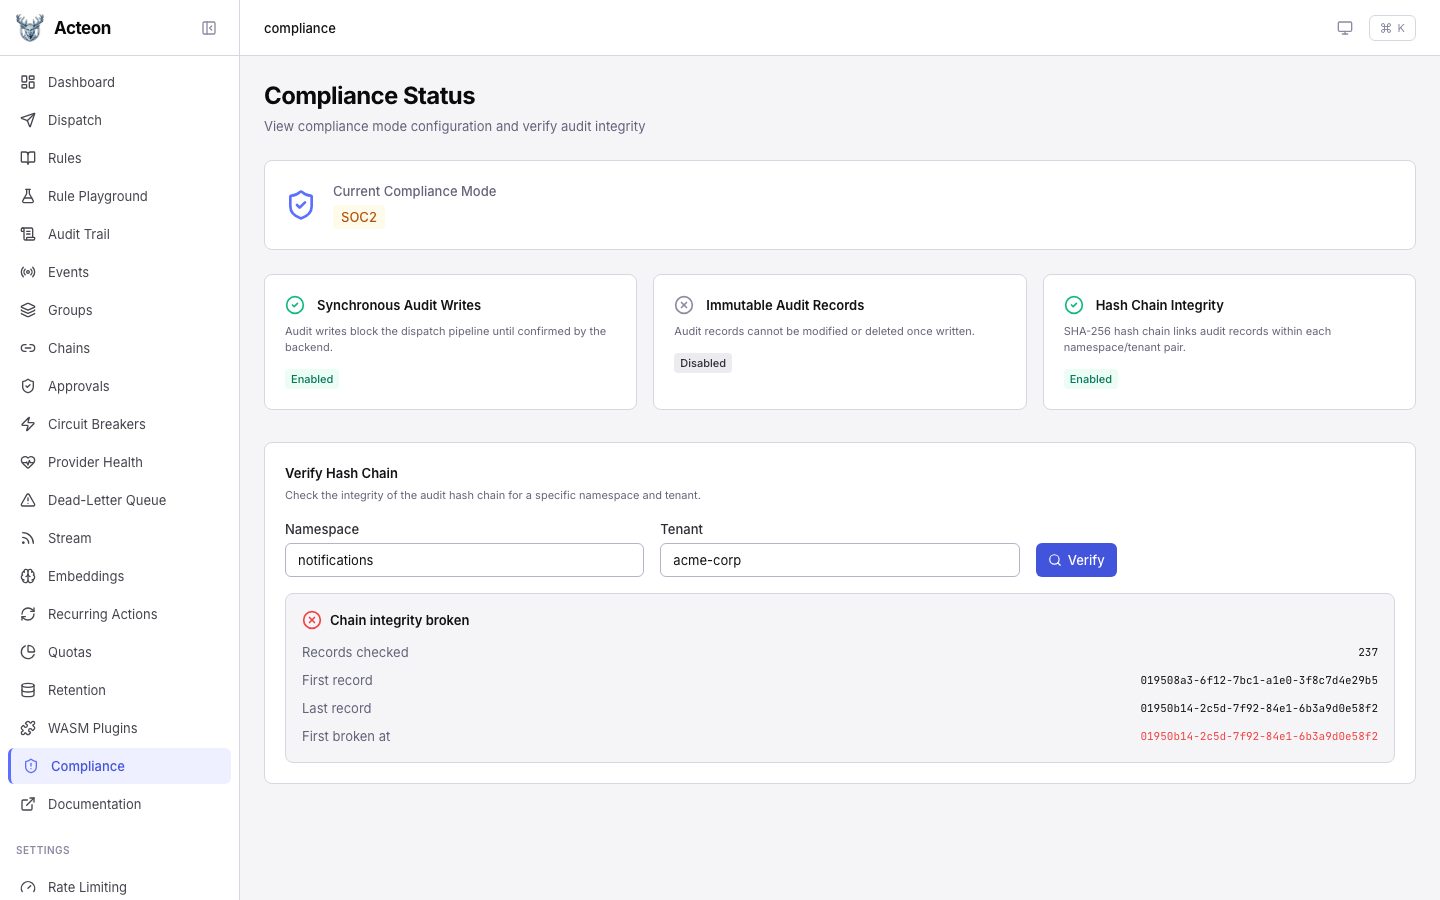
Verifying Hash Chain Integrity
When hash chaining is enabled, the verification panel lets you check the integrity of the audit chain for any namespace/tenant pair.
A valid chain:
A broken chain highlights the first record where integrity was lost:
See Compliance Mode for full documentation.
Event Stream
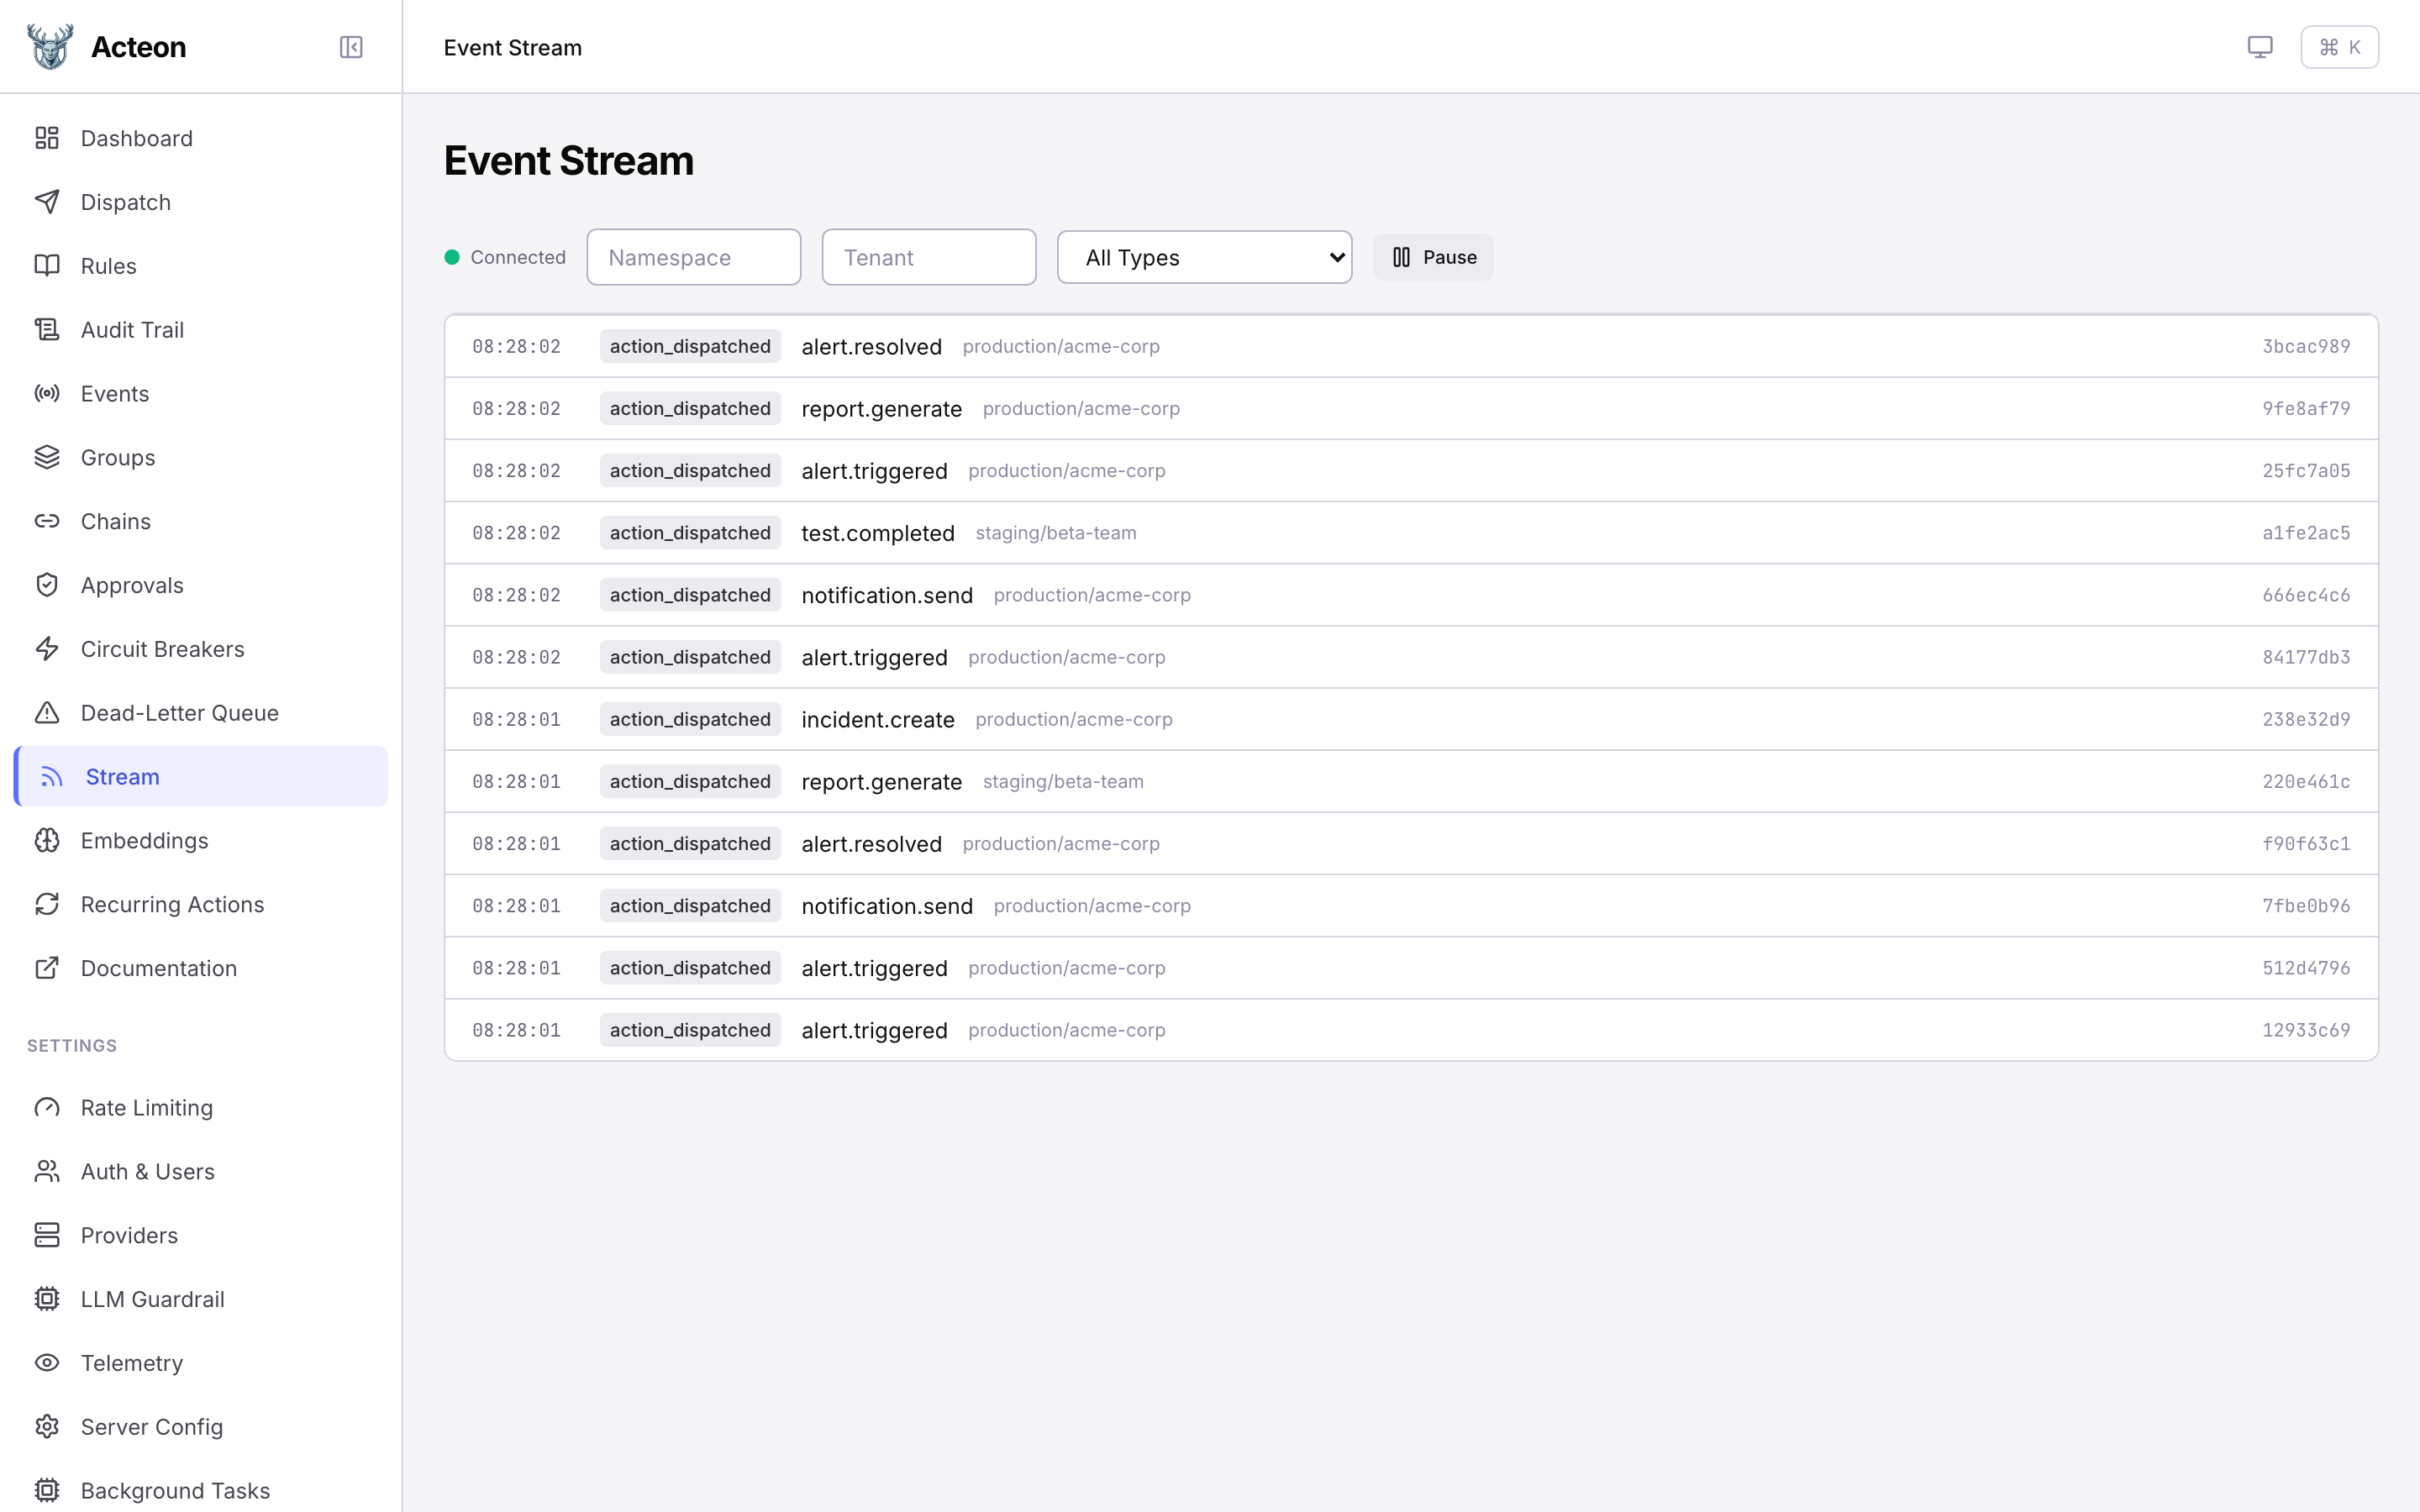
A live event stream powered by SSE. Watch actions flow through the gateway in real time with filters for namespace, tenant, and event type. Use the Pause / Resume button to freeze the stream for inspection.