Grafana Dashboard Templates
Acteon ships with pre-built Grafana dashboards and a Prometheus scrape configuration that provide immediate observability over the gateway. Two dashboards cover the full metric surface: an Overview dashboard for gateway-wide throughput and outcomes, and a Provider Health dashboard for per-provider latency percentiles and success rates.
No external dependencies are required beyond Prometheus and Grafana. The gateway exposes a lightweight Prometheus text-format endpoint (GET /metrics/prometheus) with zero third-party crate overhead.
Quick Start
The fastest way to get the full monitoring stack running is with Docker Compose:
This starts four services:
| Service | Port | Description |
|---|---|---|
acteon | 8080 | Acteon gateway (API + metrics) |
redis | 6379 | State backend |
prometheus | 9090 | Metrics scraper (15s interval) |
grafana | 3000 | Dashboard UI |
Grafana is available at http://localhost:3000 with default credentials configured in deploy/grafana/grafana.ini. Both dashboards are provisioned automatically under the Acteon folder.
Prometheus Endpoint
Returns all gateway metrics in Prometheus text exposition format (text/plain; version=0.0.4). No authentication is required for this endpoint.
The endpoint reads atomic in-memory counters and serializes them directly to the text format. There is no dependency on the prometheus crate -- the exporter is a hand-written ~80-line Axum handler that formats # HELP, # TYPE, and metric lines.
Example Response
# HELP acteon_actions_dispatched_total Total number of actions dispatched to the gateway.
# TYPE acteon_actions_dispatched_total counter
acteon_actions_dispatched_total 15482

# HELP acteon_provider_success_rate Provider success rate percentage (0-100).
# TYPE acteon_provider_success_rate gauge
acteon_provider_success_rate{provider="email"} 99.12
acteon_provider_success_rate{provider="slack"} 97.50
Exported Metrics
All metrics use the acteon_ prefix. Counters are monotonically increasing from server start; gauges reflect current computed values.
Gateway Dispatch Counters
| Metric | Type | Description |
|---|---|---|
acteon_actions_dispatched_total | counter | Total actions dispatched to the gateway |
acteon_actions_executed_total | counter | Actions successfully executed by a provider |
acteon_actions_deduplicated_total | counter | Actions skipped (deduplication) |
acteon_actions_suppressed_total | counter | Actions suppressed by a rule |
acteon_actions_rerouted_total | counter | Actions rerouted to a different provider |
acteon_actions_throttled_total | counter | Actions rejected (rate limiting) |
acteon_actions_failed_total | counter | Actions that failed after all retries |
acteon_actions_pending_approval_total | counter | Actions sent to human approval |
acteon_actions_scheduled_total | counter | Actions scheduled for delayed execution |
LLM Guardrail Counters
| Metric | Type | Description |
|---|---|---|
acteon_llm_guardrail_allowed_total | counter | Actions approved by the LLM guardrail |
acteon_llm_guardrail_denied_total | counter | Actions blocked by the LLM guardrail |
acteon_llm_guardrail_errors_total | counter | LLM guardrail evaluation errors |
Chain (Workflow) Counters
| Metric | Type | Description |
|---|---|---|
acteon_chains_started_total | counter | Task chains initiated |
acteon_chains_completed_total | counter | Task chains completed successfully |
acteon_chains_failed_total | counter | Task chains that failed |
acteon_chains_cancelled_total | counter | Task chains cancelled |
Circuit Breaker Counters
| Metric | Type | Description |
|---|---|---|
acteon_circuit_open_total | counter | Actions rejected (circuit breaker open) |
acteon_circuit_transitions_total | counter | Circuit breaker state transitions |
acteon_circuit_fallbacks_total | counter | Actions rerouted to fallback provider |
Recurring Action Counters
| Metric | Type | Description |
|---|---|---|
acteon_recurring_dispatched_total | counter | Recurring actions dispatched |
acteon_recurring_errors_total | counter | Recurring action dispatch errors |
acteon_recurring_skipped_total | counter | Recurring actions skipped |
acteon_recurring_active | gauge | Recurring actions currently scheduled and eligible for dispatch |
Quota Counters
| Metric | Type | Description |
|---|---|---|
acteon_quota_exceeded_total | counter | Actions blocked by tenant quota (HTTP 429) |
acteon_quota_warned_total | counter | Actions passed with a quota warning |
acteon_quota_degraded_total | counter | Actions degraded to fallback provider |
acteon_quota_notified_total | counter | Quota threshold notifications sent |
Retention Reaper Counters
| Metric | Type | Description |
|---|---|---|
acteon_retention_deleted_state_total | counter | State entries deleted by retention reaper |
acteon_retention_skipped_compliance_total | counter | Entries skipped due to compliance hold |
acteon_retention_errors_total | counter | Retention reaper errors |
Embedding Cache Counters
These metrics are only emitted when an embedding provider is configured.
| Metric | Type | Description |
|---|---|---|
acteon_embedding_topic_cache_hits_total | counter | Topic embeddings served from cache |
acteon_embedding_topic_cache_misses_total | counter | Topic embeddings requiring API call |
acteon_embedding_text_cache_hits_total | counter | Text embeddings served from cache |
acteon_embedding_text_cache_misses_total | counter | Text embeddings requiring API call |
acteon_embedding_errors_total | counter | Embedding provider errors |
acteon_embedding_fail_open_total | counter | Fail-open returns (similarity 0.0) |
Per-Provider Metrics
These metrics carry a provider label and are emitted for each registered provider.
| Metric | Type | Description |
|---|---|---|
acteon_provider_requests_total | counter | Total requests to the provider |
acteon_provider_successes_total | counter | Successful provider executions |
acteon_provider_failures_total | counter | Failed provider executions |
acteon_provider_success_rate | gauge | Success rate percentage (0-100) |
acteon_provider_avg_latency_ms | gauge | Average latency in milliseconds |
acteon_provider_p50_latency_ms | gauge | Median latency in milliseconds |
acteon_provider_p95_latency_ms | gauge | 95th percentile latency in milliseconds |
acteon_provider_p99_latency_ms | gauge | 99th percentile latency in milliseconds |
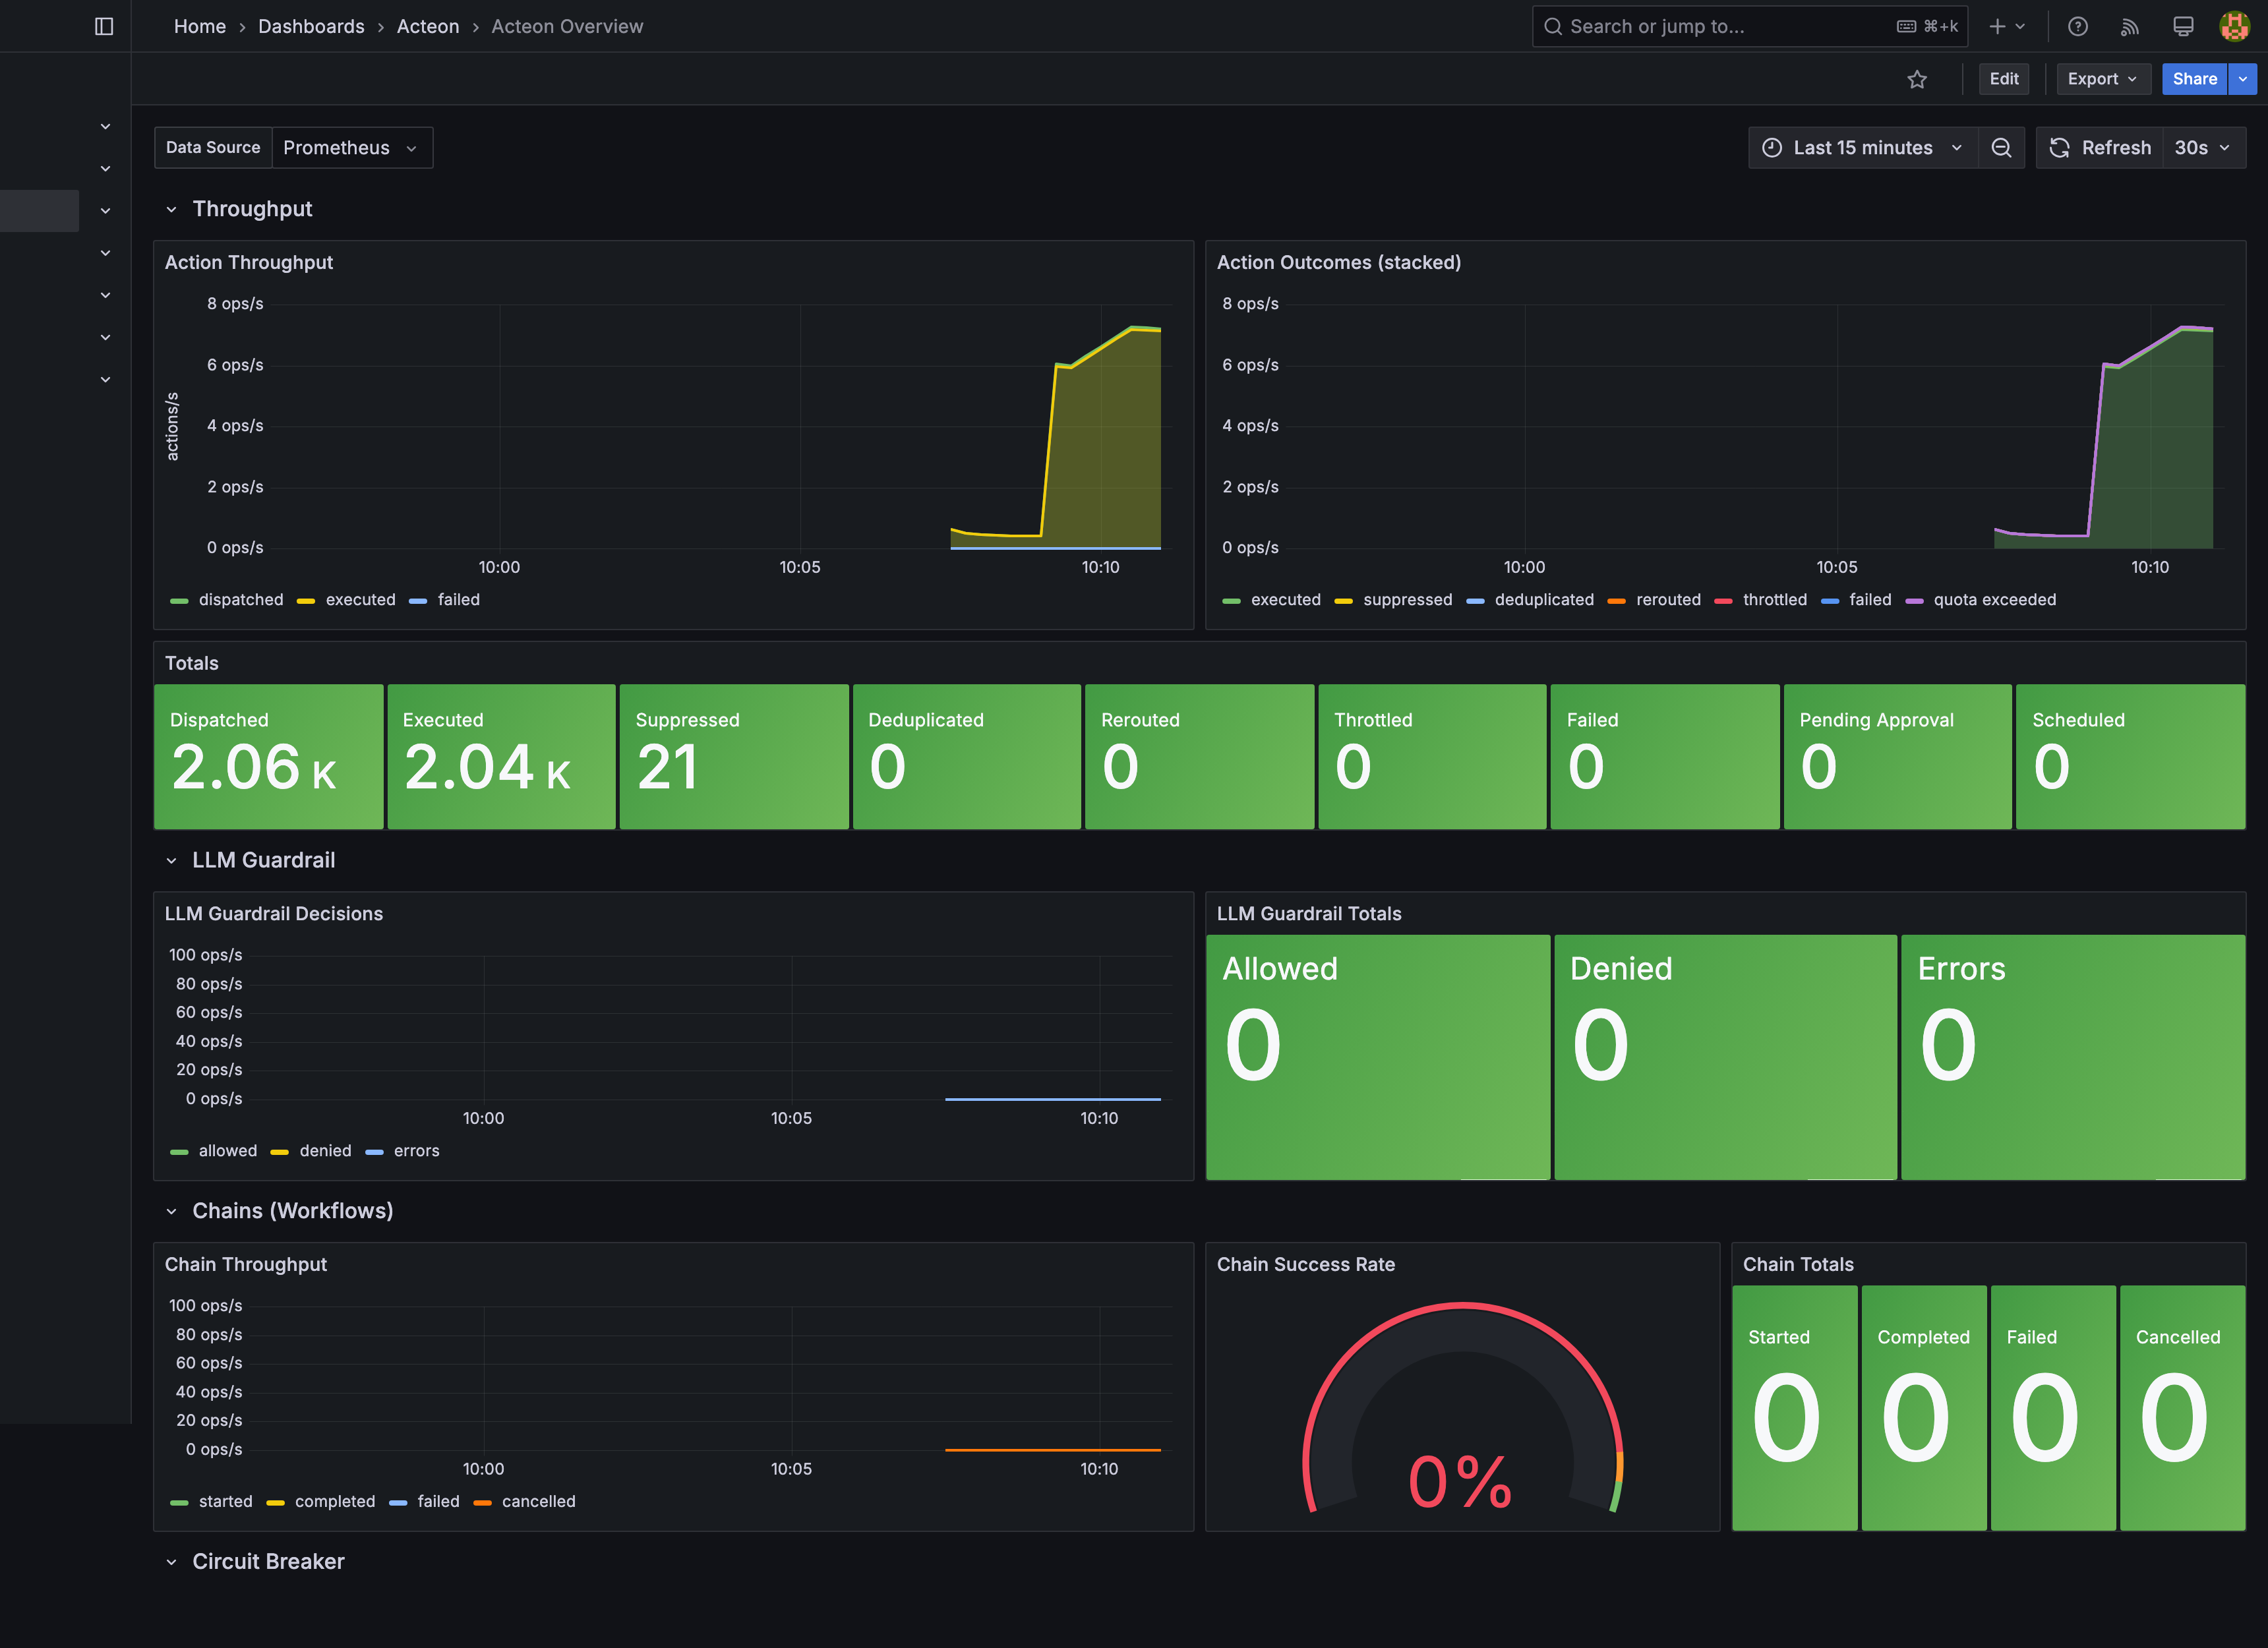
Overview Dashboard
The Acteon Overview dashboard (acteon-overview.json) provides a high-level view of gateway activity across seven collapsible row sections:
Throughput
- Action Throughput (timeseries) -- Dispatched, executed, and failed action rates over time using
rate(...[5m]). - Action Outcomes (stacked) (timeseries) -- Stacked area chart showing the breakdown of all outcome types (executed, suppressed, deduplicated, rerouted, throttled, failed).
- Totals (stat) -- Absolute counter values for all nine action outcome types. Failed and throttled counters turn red/orange when non-zero.
LLM Guardrail
- LLM Guardrail Decisions (timeseries) -- Allowed, denied, and error rates.
- LLM Guardrail Totals (stat) -- Absolute counts with sparkline area graphs.
Chains (Workflows)
- Chain Throughput (timeseries) -- Started, completed, failed, and cancelled chain rates.
- Chain Success Rate (gauge) -- Completed / started ratio. Green above 95%, orange 90-95%, red below 90%.
- Chain Totals (stat) -- Absolute chain lifecycle counts.
Circuit Breaker
- Circuit Breaker Activity (timeseries) -- Open rejections, state transitions, and fallback reroutes.
- Circuit Breaker Totals (stat) -- Absolute counts; non-zero values turn red.
Recurring Actions
- Recurring Action Totals (stat) -- Dispatched, errors, and skipped counts. Error count turns red when non-zero.
- Recurring Action Rate (timeseries) -- Dispatched and error rates over time.
Quotas & Retention
- Quota Totals (stat) -- Exceeded (red when > 0), warned, degraded, and notified counts.
- Retention Reaper Totals (stat) -- Deleted, compliance hold (skipped), and error counts.
Embedding Cache
- Embedding Cache Hit/Miss Rate (timeseries) -- Topic and text cache hit/miss rates.
- Topic Cache Hit Rate (gauge) -- Green above 80%, orange 50-80%, red below 50%.
- Text Cache Hit Rate (gauge) -- Same thresholds as topic cache.
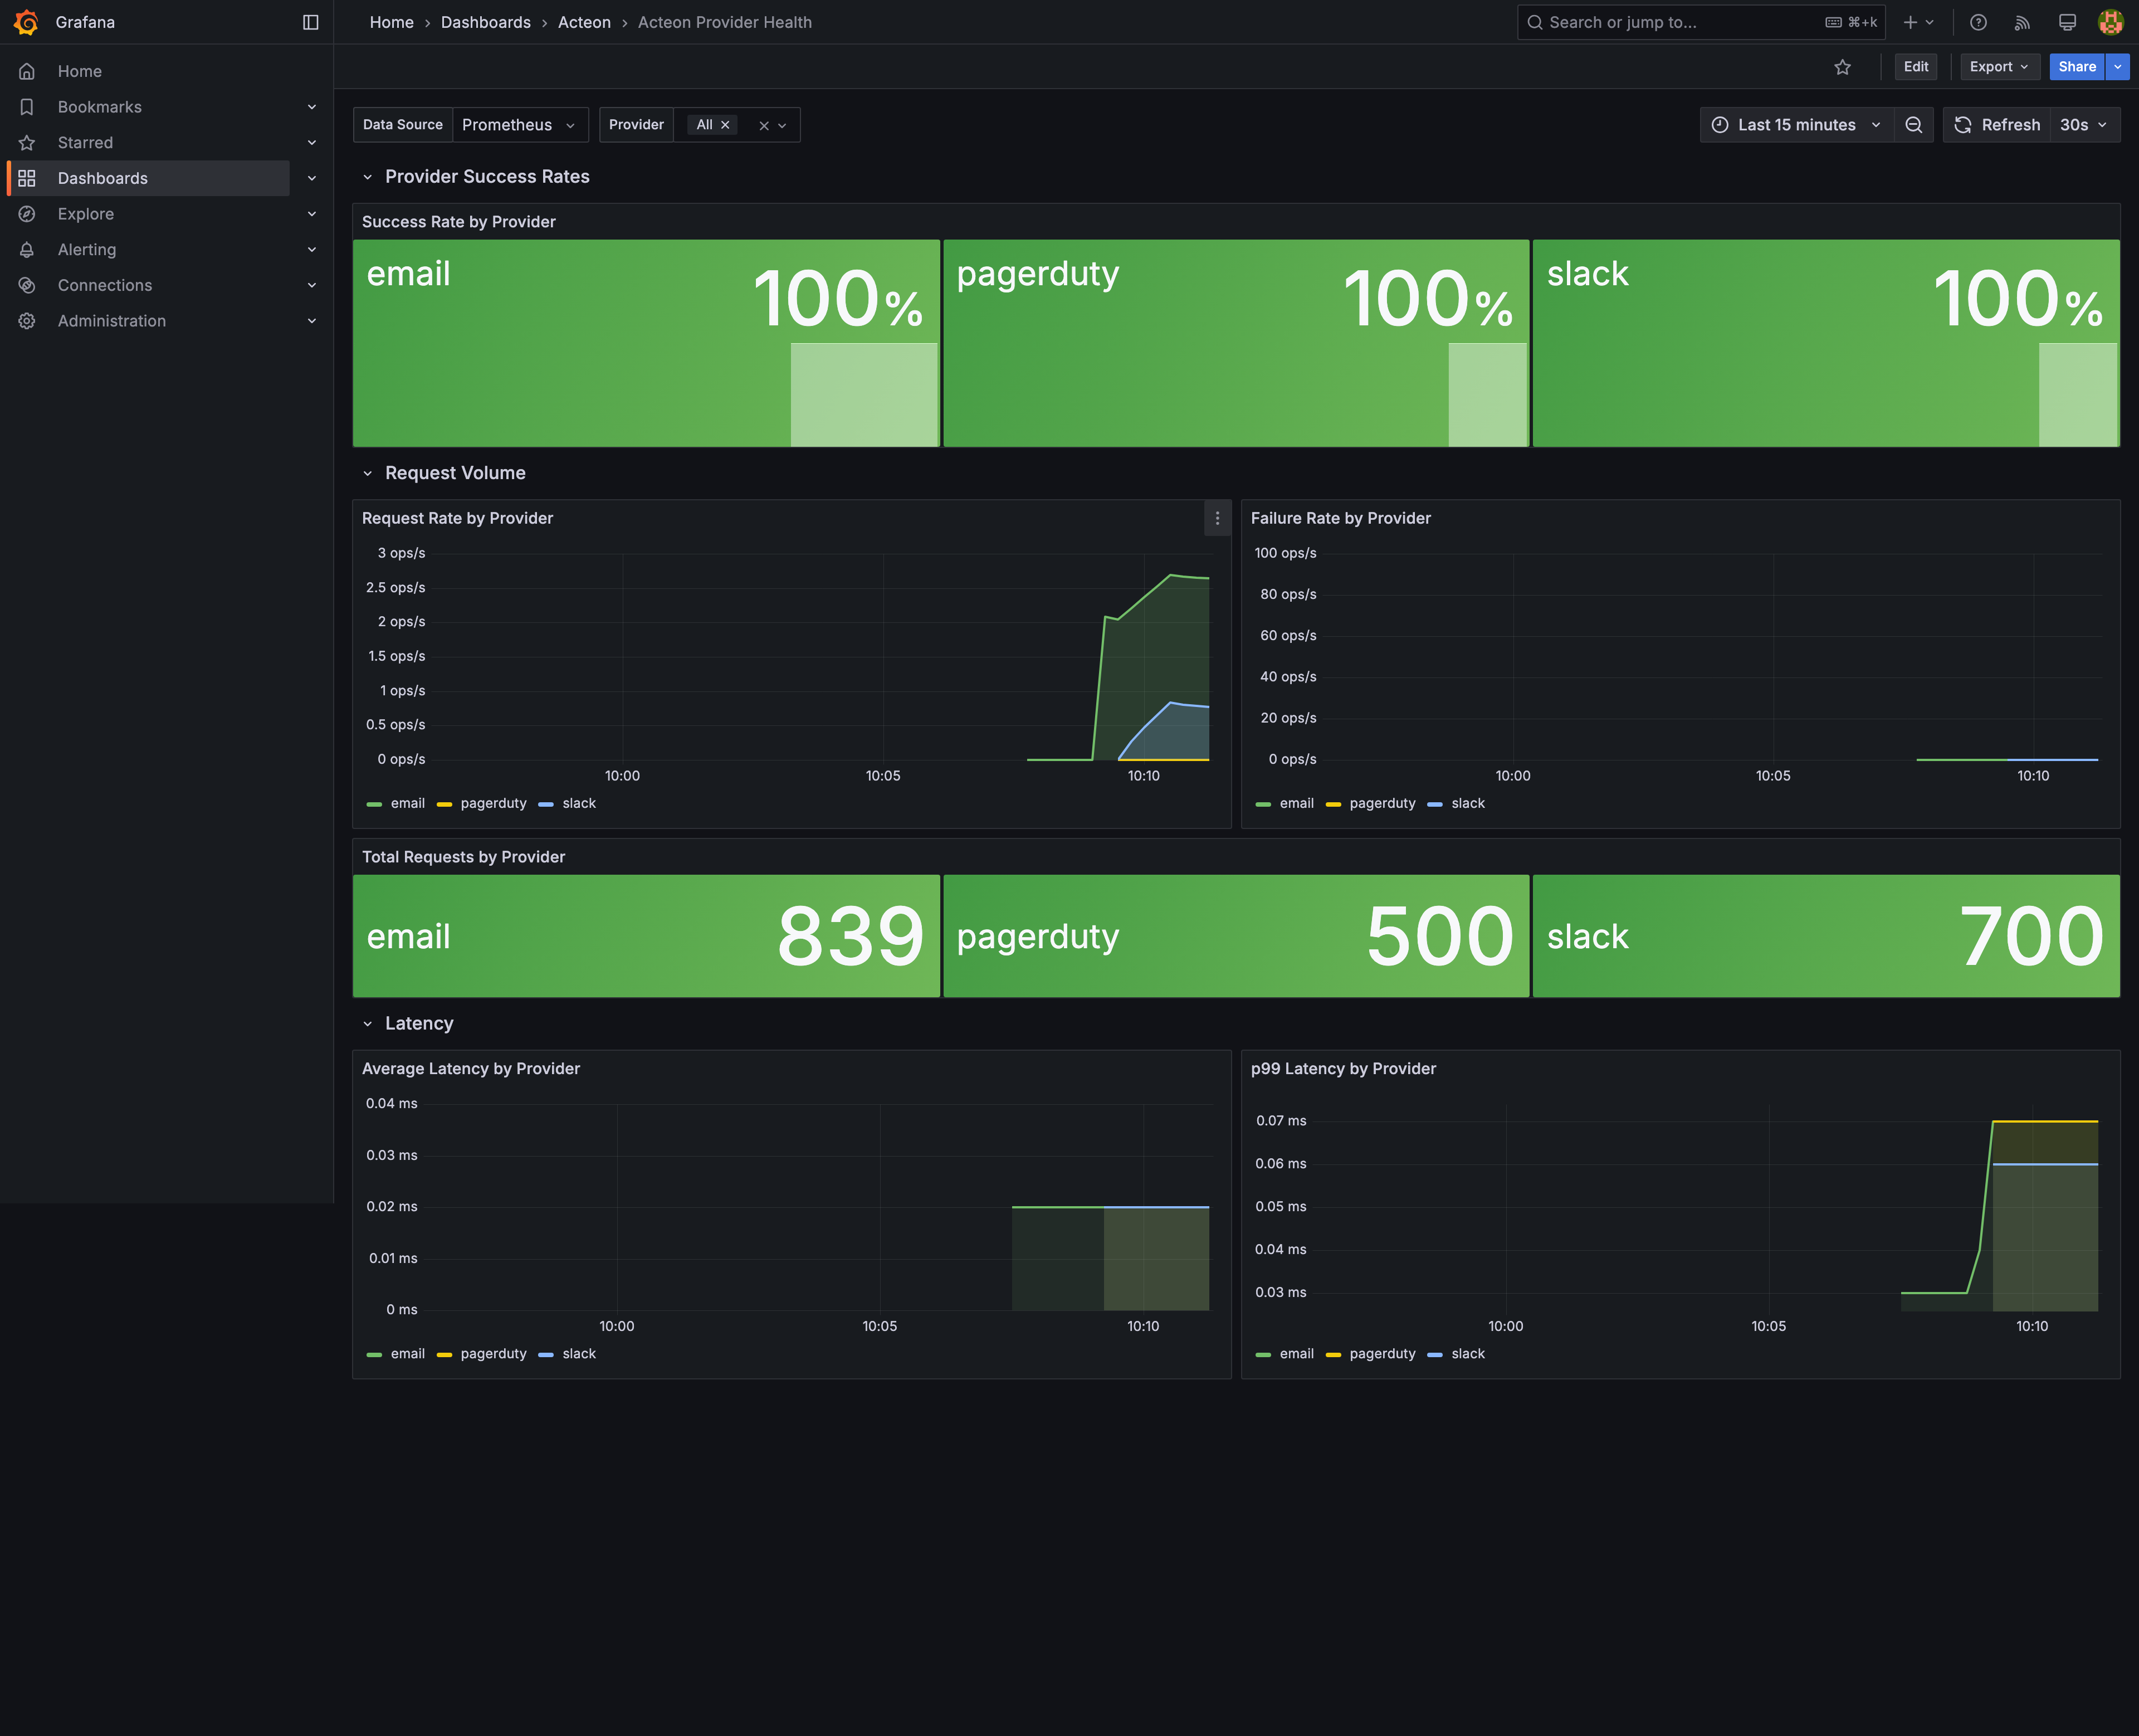
Provider Health Dashboard
The Acteon Provider Health dashboard (acteon-provider-health.json) provides per-provider observability across three row sections:
Provider Success Rates
- Success Rate by Provider (stat) -- Large stat panels showing each provider's success rate percentage. Color-coded: green (>= 99%), yellow (>= 95%), orange (>= 90%), red (< 90%).
Request Volume
- Request Rate by Provider (timeseries) -- Per-provider request rate using
rate(acteon_provider_requests_total[5m]). - Failure Rate by Provider (timeseries) -- Per-provider failure rate.
- Total Requests by Provider (stat) -- Absolute request counts per provider.
Latency
- Average Latency by Provider (timeseries) -- Average latency in milliseconds per provider over time.
- p99 Latency by Provider (timeseries) -- 99th percentile latency per provider over time.
- Latency Percentile Summary (table) -- Combined table with columns: Provider, p50 Latency, p95 Latency, p99 Latency, Avg Latency, and Success Rate. Success Rate column is color-coded by threshold.
Standalone Setup
If you are not using Docker Compose, you can set up monitoring manually.
1. Configure Prometheus
Add an Acteon scrape job to your prometheus.yml:
scrape_configs:
  - job_name: "acteon"
    metrics_path: "/metrics/prometheus"
    scrape_interval: 15s
    static_configs:
      - targets: ["localhost:8080"]
        labels:
          service: "acteon-gateway"
For multiple Acteon instances, list all targets:
2. Import Dashboards into Grafana
Import the dashboard JSON files from the deploy/grafana/dashboards/ directory:
- Open Grafana and navigate to Dashboards > Import.
- Click Upload JSON file and select
acteon-overview.json. - Select your Prometheus datasource for the
DS_PROMETHEUSvariable. - Repeat for
acteon-provider-health.json.
Alternatively, use Grafana provisioning by copying the files from deploy/grafana/provisioning/ into your Grafana configuration directory:
/etc/grafana/provisioning/
  datasources/
    prometheus.yml          # Points to your Prometheus instance
  dashboards/
    dashboards.yml          # Points to the dashboard JSON directory
The provisioning datasource config (deploy/grafana/provisioning/datasources/prometheus.yml):
apiVersion: 1
datasources:
  - name: Prometheus
    type: prometheus
    access: proxy
    url: http://prometheus:9090
    isDefault: true
    editable: false
The provisioning dashboard config (deploy/grafana/provisioning/dashboards/dashboards.yml):
apiVersion: 1
providers:
  - name: "Acteon"
    orgId: 1
    folder: "Acteon"
    type: file
    disableDeletion: false
    editable: true
    options:
      path: /var/lib/grafana/dashboards
      foldersFromFilesStructure: false
3. Verify
- Open Prometheus at
http://localhost:9090/targetsand confirm theacteonjob shows status UP. - Open Grafana at
http://localhost:3000and navigate to the Acteon folder. Both dashboards should be listed. - Dispatch a few actions through the gateway and watch metrics populate.
Customization
Adding Custom Panels
Both dashboards use a DS_PROMETHEUS template variable for the datasource. To add custom panels:
- Open a dashboard in Grafana and click Edit.
- Add a new panel and select
${DS_PROMETHEUS}as the datasource. - Use any
acteon_*metric in your PromQL queries. - Save the dashboard.
Since provisioned dashboards are set to editable: true, changes persist in Grafana's storage. To make changes permanent across deployments, export the modified dashboard JSON and commit it to deploy/grafana/dashboards/.
Useful PromQL Queries
Overall success rate:
Action failure rate (5-minute window):
rate(acteon_actions_failed_total[5m]) / clamp_min(rate(acteon_actions_dispatched_total[5m]), 0.001) * 100
Provider with highest p99 latency:
Quota usage trending toward limit:
Alerting
Grafana supports alerting directly from dashboard panels. Recommended alert rules:
| Alert | Condition | Severity |
|---|---|---|
| High failure rate | rate(acteon_actions_failed_total[5m]) > 0.1 | Warning |
| Provider down | acteon_provider_success_rate < 50 | Critical |
| Circuit breaker tripped | increase(acteon_circuit_open_total[5m]) > 0 | Warning |
| Quota exceeded | increase(acteon_quota_exceeded_total[5m]) > 0 | Warning |
| Retention errors | increase(acteon_retention_errors_total[5m]) > 0 | Warning |
| Embedding cache degraded | acteon_embedding_topic_cache_hits_total / (acteon_embedding_topic_cache_hits_total + acteon_embedding_topic_cache_misses_total) < 0.5 | Info |
To configure alerts, edit a panel, switch to the Alert tab, and define thresholds. See the Grafana alerting documentation for details on notification channels and routing.
Configuration Reference
Prometheus Scrape Config
| Setting | Default | Description |
|---|---|---|
scrape_interval | 15s | How often Prometheus scrapes the endpoint |
metrics_path | /metrics/prometheus | Acteon metrics endpoint path |
storage.tsdb.retention.time | 30d | How long Prometheus retains time-series data |
Grafana Configuration
Grafana is configured via deploy/grafana/grafana.ini, which is mounted into the container at /etc/grafana/grafana.ini. Key settings:
| Section | Key | Default | Description |
|---|---|---|---|
[security] | admin_user | admin | Grafana admin username |
[security] | admin_password | (encoded) | Grafana admin password |
[users] | allow_sign_up | false | Disable self-registration |
Dashboard Settings
Both dashboards share these settings:
| Setting | Value | Description |
|---|---|---|
| Auto-refresh | 30s | Dashboard refresh interval |
| Default time range | Last 1 hour | Initial time window |
| Timezone | Browser | Respects the viewer's local timezone |
| Tags | acteon | Dashboard tag for search/filtering |
Production Hardening
Authentication
The default Docker Compose setup uses credentials from deploy/grafana/grafana.ini. For production:
- Change the admin password in
grafana.inior override it via the Grafana UI on first login. - Enable Grafana's built-in LDAP, OAuth, or SAML authentication.
- Consider placing Prometheus behind a reverse proxy with authentication -- the
/metrics/prometheusendpoint exposes operational data.
# deploy/grafana/grafana.ini
[security]
admin_password = your_production_password

[auth.generic_oauth]
enabled = true
# ... OAuth config
Data Retention
Prometheus defaults to 30 days of retention. Adjust based on your storage budget:
For long-term storage, consider Thanos or Cortex as a remote write backend.
High Availability
For production HA deployments:
- Prometheus: Run two independent Prometheus instances scraping the same targets. Use Thanos or similar for deduplication and unified querying.
- Grafana: Grafana supports HA mode with a shared PostgreSQL or MySQL database for session/dashboard storage.
- Acteon: Each Acteon instance exposes its own
/metrics/prometheusendpoint. List all instances as Prometheus targets and usesum(rate(...))in PromQL to aggregate.
Network Security
- Restrict Prometheus scrape access to internal networks only.
- Use TLS between Prometheus and Grafana (
GF_SERVER_PROTOCOL=https). - The
/metrics/prometheusendpoint does not require authentication by default. If your Acteon server is publicly accessible, use a reverse proxy or firewall rule to restrict access to the metrics endpoint.
File Layout
deploy/
  grafana/
    grafana.ini                      # Grafana server configuration (auth, security)
    dashboards/
      acteon-overview.json           # Gateway overview dashboard
      acteon-provider-health.json    # Per-provider health dashboard
    provisioning/
      dashboards/
        dashboards.yml               # Dashboard provisioning config
      datasources/
        prometheus.yml               # Prometheus datasource config
  prometheus/
    prometheus.yml                   # Prometheus scrape configuration